
Table of contents:
In our previous 2Smart blog posts, we’ve covered how to connect Modbus devices to the monitoring and automation platform, 2Smart Standalone, using a Teltonika gateway. This setup allows for controlling and managing sensor readings through automation scenarios. We also demonstrated how to configure an OpenVPN connection for cloud deployment of the automation platform, as well as how to integrate it with the 2Smart Cloud mobile application. This solution allows for remote management of Modbus equipment and monitoring of its sensor readings from anywhere with internet access. But what about monitoring the telemetry of the Teltonika gateway itself? This is crucial since it includes precise GPS coordinates of the gateway and statistics of the GSM traffic used. Such information is vital, for example, in cargo transportation scenarios, where the Modbus gateway allows monitoring of cargo transport conditions and tracking its location. In this article, the 2Smart team explains how to set up remote monitoring of Teltonika gateway telemetry within the interface of the 2Smart Standalone automation platform.
What useful telemetry does the Teltonika gateway provide?
In our experiments, we are using the Teltonika TRB-245 gateway, and the set of metrics may vary depending on the device model. However, according to feedback from other users of the same model gateway who use it in the real world, the most valuable metrics for them are those that describe the statistics and status of the GSM module, as well as GPS coordinates.
GSM metrics
The Teltonika TRB-245 gateway can provide the following telemetry related to GSM connection:
- mobile signal strength,
- GSM operator name,
- currently active SIM card slot,
- active SIM card,
- mobile data received today (separately for SIM1 and SIM2),
- mobile data sent today (separately for SIM1 and SIM2),
- mobile data received last 24h (separately for SIM1 and SIM2),
- mobile data sent last 24h (separately for SIM1 and SIM2),
- mobile data received this week (separately for SIM1 and SIM2),
- mobile data sent this week (separately for SIM1 and SIM2),
- mobile data received last week (separately for SIM1 and SIM2),
- mobile data sent last week (separately for SIM1 and SIM2),
- mobile data received this month (separately for SIM1 and SIM2),
- mobile data sent this month (separately for SIM1 and SIM2),
- mobile data received last month (separately for SIM1 and SIM2),
- mobile data sent last month (separately for SIM1 and SIM2).
This telemetry is invaluable in cases where mobile internet is the primary means of connecting the Teltonika gateway to the world or when GSM is used in deploying local IoT infrastructure. Administrators can remotely monitor connection quality and traffic consumption. By setting up corresponding alerts, they can instantly be notified of critical drops in signal strength or traffic overages.
GPS metrics
The following metrics allow you to monitor both the precise geographical location of the device and the quality of the GPS connection:
- GPS latitude coordinate,
- GPS longitude coordinate,
- GPS fix time,
- GPS date and time,
- GPS speed,
- GPS satellite count,
- GPS accuracy.
These metrics are less critical when the gateway operates at a stationary location. However, they become indispensable in scenarios such as monitoring the vehicle’s location during transportation.
Let’s collaborate
We’re empower your business with our technology expertise
Remote monitoring of Teltonika gateway telemetry using open-source 2Smart Standalone automation platform
Previously, we experimented with various methods of connecting the Teltonika gateway to the 2Smart automation platform. Thanks to the gateway’s software features, there can indeed be several methods. However, the primary approach is to use the platform’s native Modbus bridge, where the interaction between the gateway and the platform occurs according to the standards of this protocol. This method was used in the experiment described below.
The Teltonika TRB-245 gateway can provide pre-configured sets of telemetry data, such as basic device information (firmware version, local time), MNF info, as well as technical information about the built-in GSM module, which is not related to traffic usage statistics (operator name, IMEI, CON state, IP, RSSI, etc.).
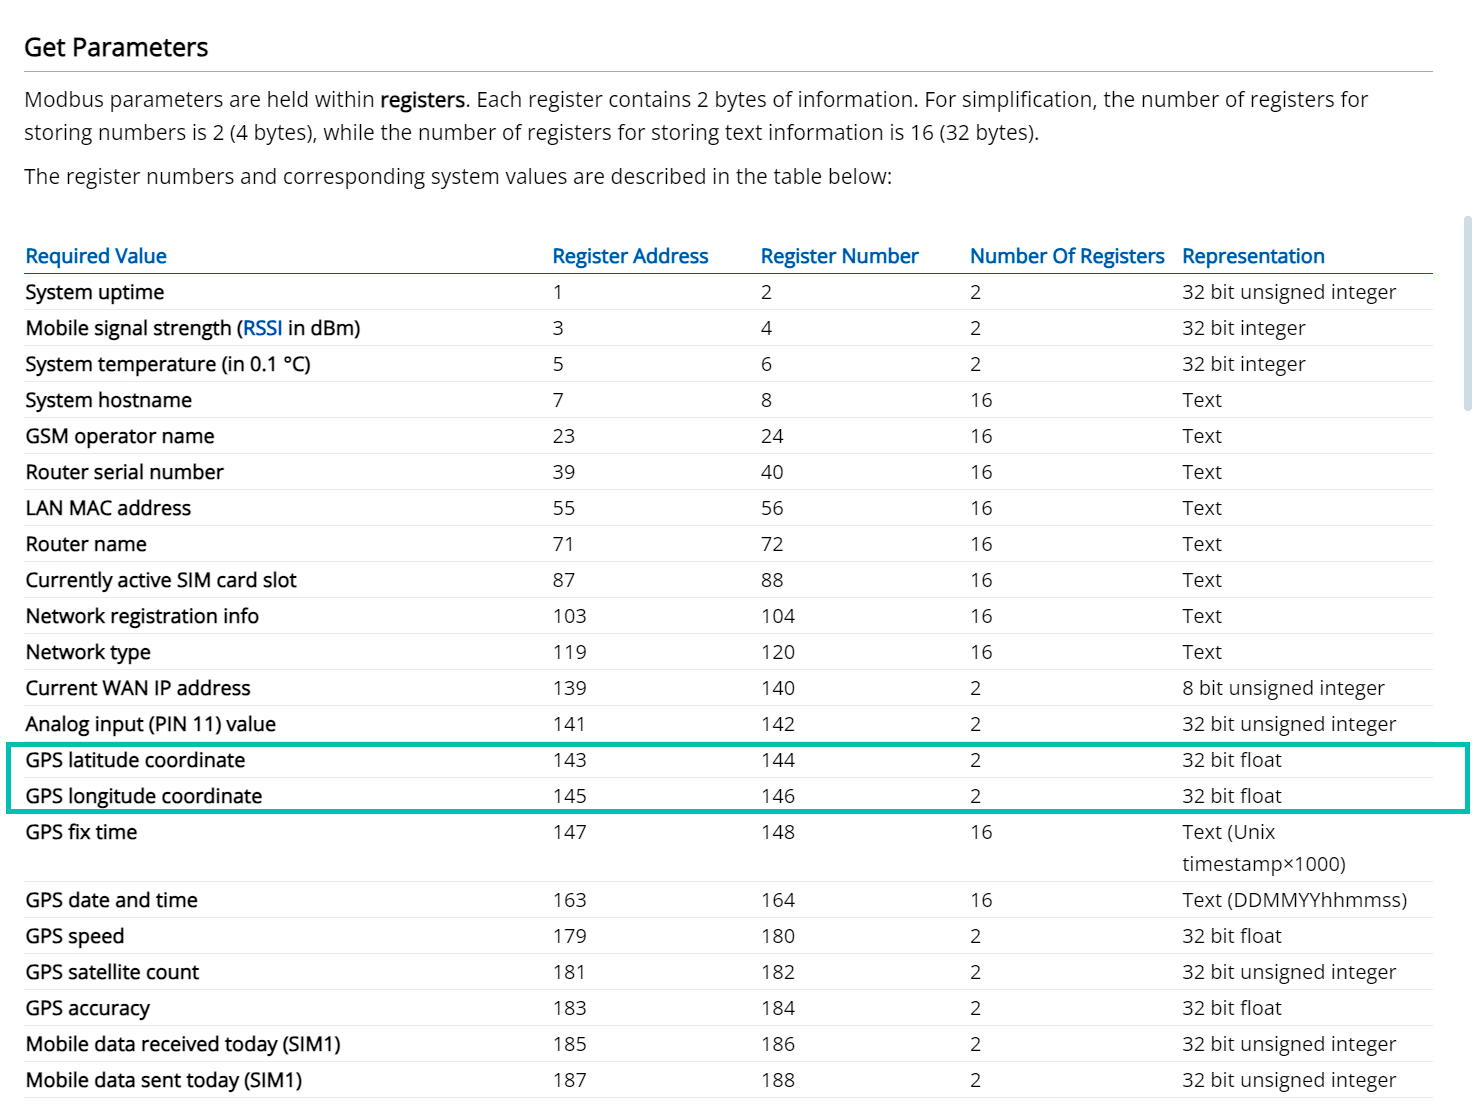
In addition, the gateway’s software includes functionality for monitoring via Modbus, where the device responds to Modbus queries and transmits various detailed metrics. The manufacturer provides a table of these metrics in the documentation via the link, and the administrator can select the required ones. This is how you can receive telemetry for GPS and GSM traffic.
Since the greatest interest lies in the metrics whose set needs to be configured manually, let’s start with that.
Configuring the set of metrics for GPS and GSM traffic monitoring
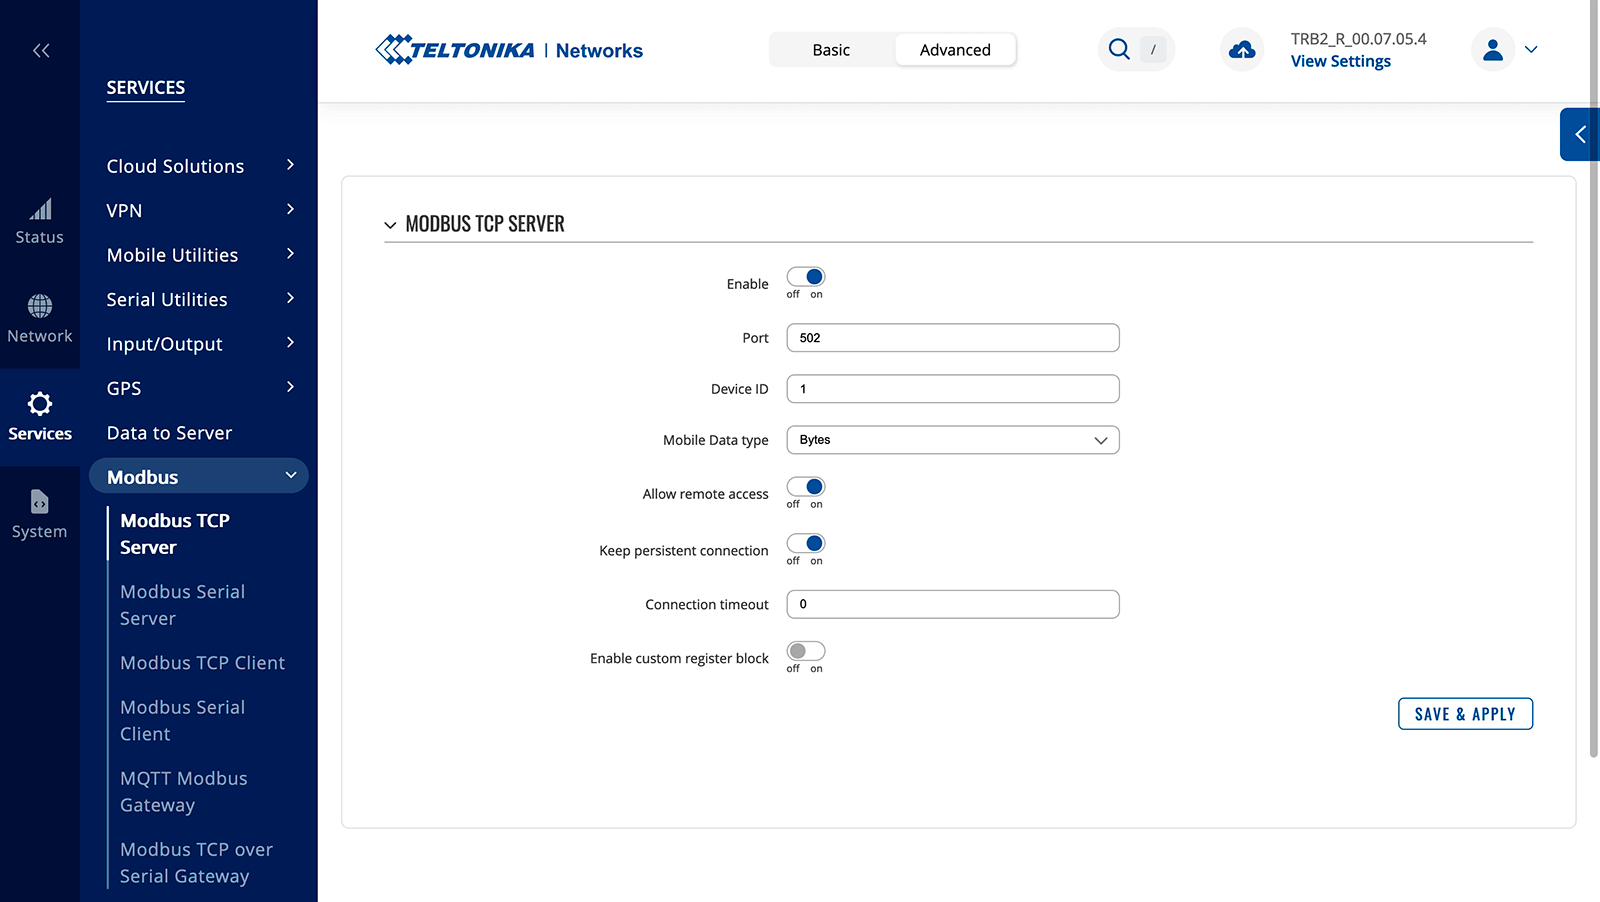
- In the gateway’s web admin panel, navigate to Services -> Modbus -> Modbus TCP Server and toggle the Enable switch to activate it.

- Next, go to Services -> Modbus -> Modbus TCP Client. Activate it by toggling the Enable switch.
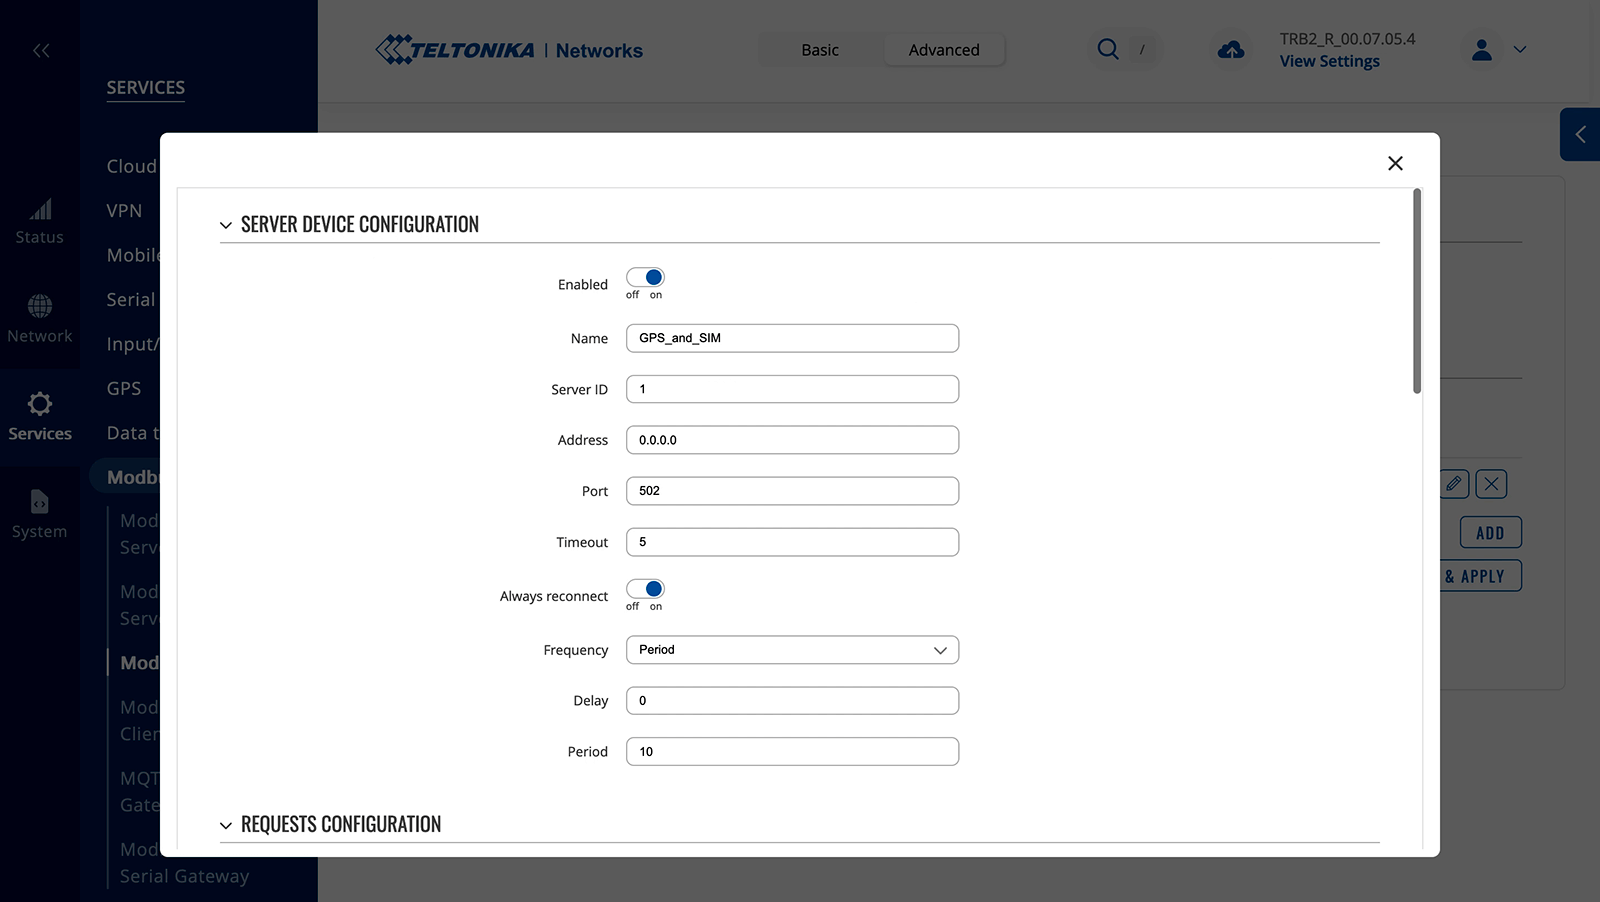
- In the Modbus TCP server devices section, click the Add button and configure a new device.
- Choose a name for the device.
- In the Server ID field, enter the same value as in the Device ID field in the server settings.
- Use the value 0.0.0.0 in the Address field.
- Use the same value as in the server settings for the Port field.
- Set a convenient timeout and data refresh rate for you.
- In the Requests configuration section, configure the telemetry you need, referring to the table in the official Teltonika documentation.
Let’s take a closer look at how to use the table to configure requests. First, let’s consider a parameter like GPS coordinates, latitude, and longitude. According to the table, the Register Address for latitude is 143 (145 for longitude), and the Register Number is 144 (146). For both latitude and longitude, the Number Of Registers is 2, and the Representation is a 32-bit float.
Since the data type is the same in both cases (32-bit float), and the values are consecutive in the register, we can retrieve them with a single request to later display them in a single line. Therefore, in the gateway’s web admin panel, we do the following:
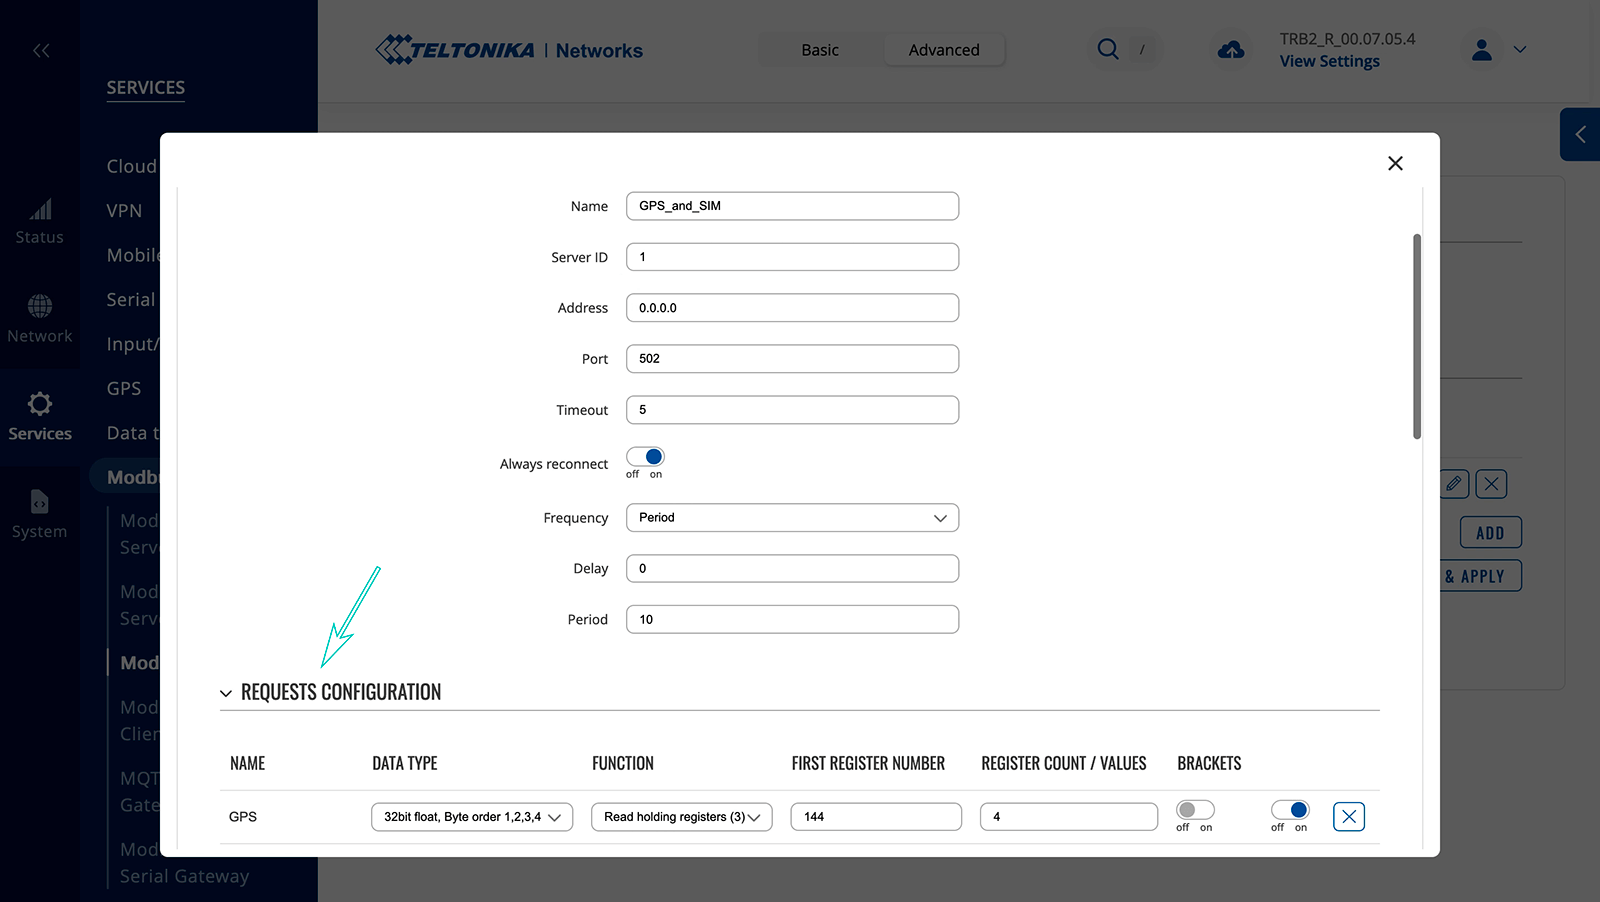
- In the Requests configuration section, add a new request and name it – for example, GPS.
- In the Data Type dropdown, select “32-bit float, Byte order 1,2,3,4”, which corresponds to the value in the Representation column in the table, with the standard byte order.
- In the Function dropdown, select “Read holding registers (3)”.
- In the First register number field, enter the value 144 (the register number for the first field from the table we are interested in – GPS latitude coordinate).
- In the Register count/values field, enter 4 – this is the sum of values from the Number Of Registers column for GPS latitude coordinate (2) and GPS longitude coordinate (2) – this way, we retrieve them together with one request.
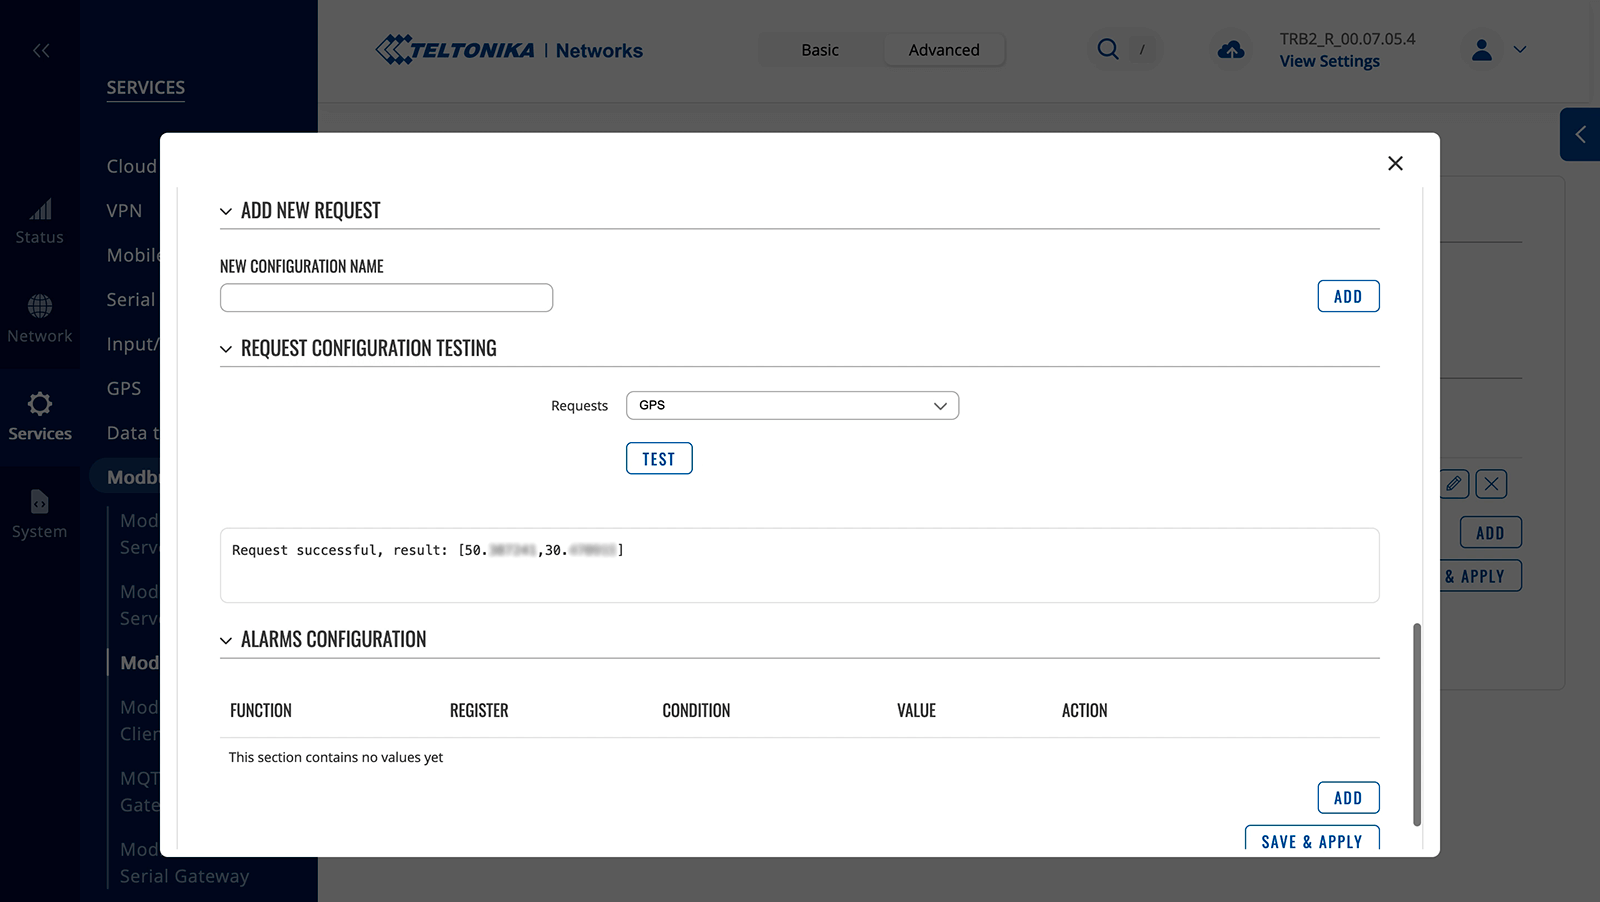
- To check if the request is working correctly, you can use the Request Configuration Testing section. To do so, select the created request from the list and click the Test button.
We added all other requests for which we want to see the results as telemetry from the Teltonika gateway for remote monitoring using the same principle. The key here is to carefully follow the table in the Teltonika documentation and specify the correct data type. For example, if it’s textual data, then in the Data Type dropdown menu, you should select ASCII.
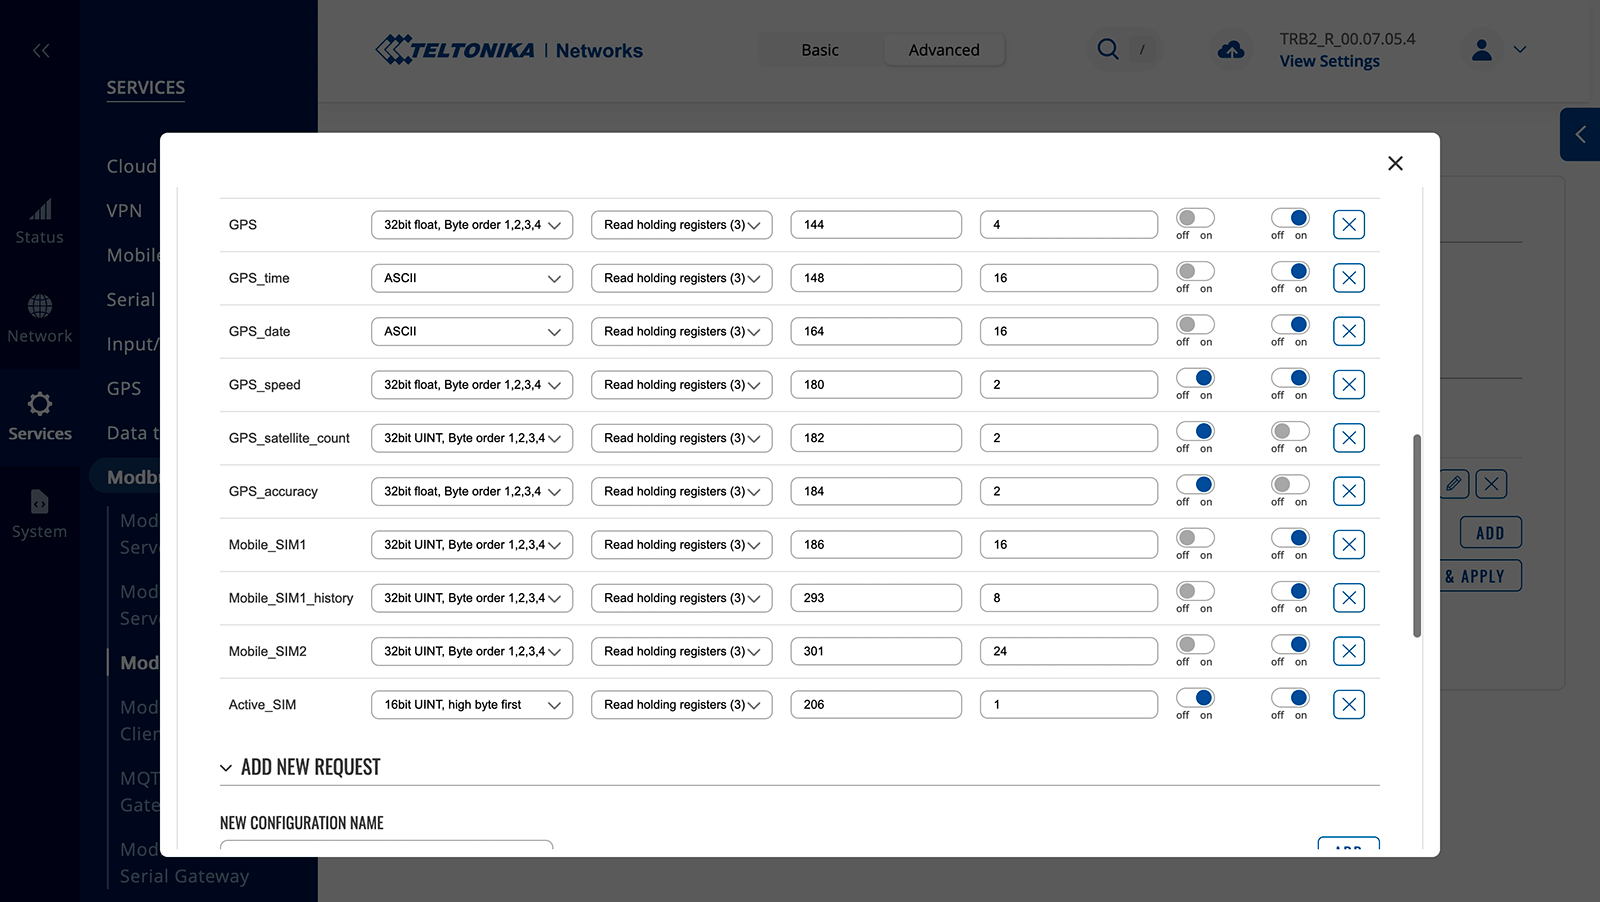
We recommend fetching multiple data with a single request whenever possible, just as we described earlier when GPS latitude and longitude are retrieved with a single combined request. For instance, we similarly retrieved 12 fields of traffic usage statistics on SIM2. This is faster and more convenient at this stage. Later, we’ll show how we handled the results of such requests and separated them from each other to display them correctly on the automation platform dashboard.
After configuring the desired requests, we saved the changes and proceeded to set up the data collection to be transmitted to the automation platform for remote monitoring.
Let’s collaborate
We’re empower your business with our technology expertise
Configuring data collection for display on the automation platform dashboard
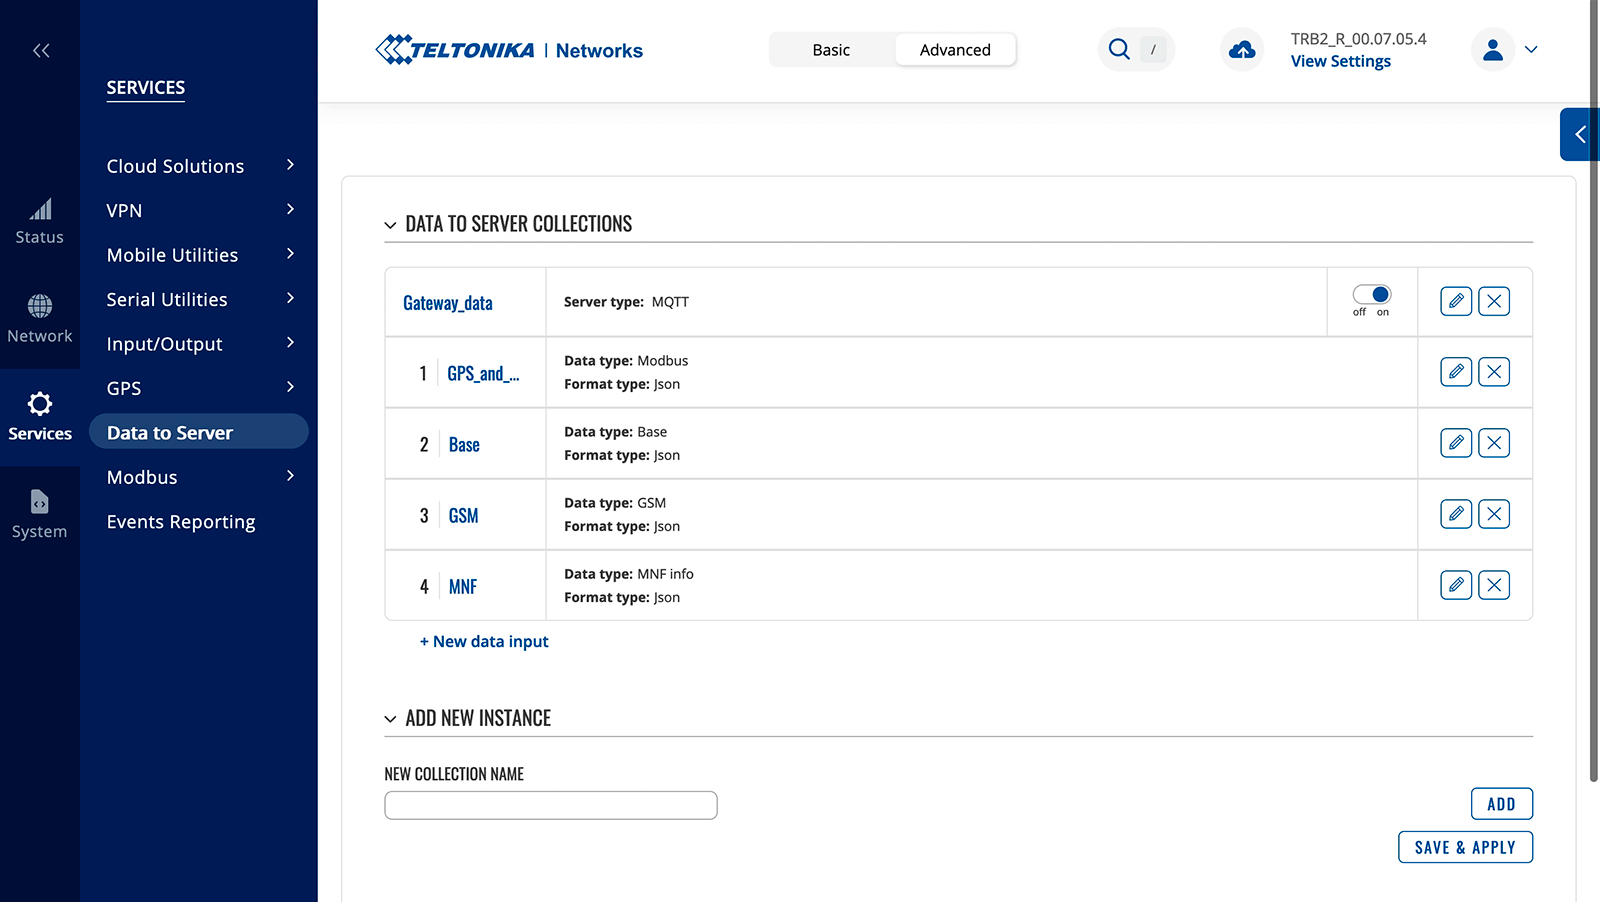
To configure the transmission of necessary telemetry to the 2Smart Standalone monitoring and automation platform, we need to set up a data collection in the “Data to Server” section of the built-in web admin panel of the gateway:
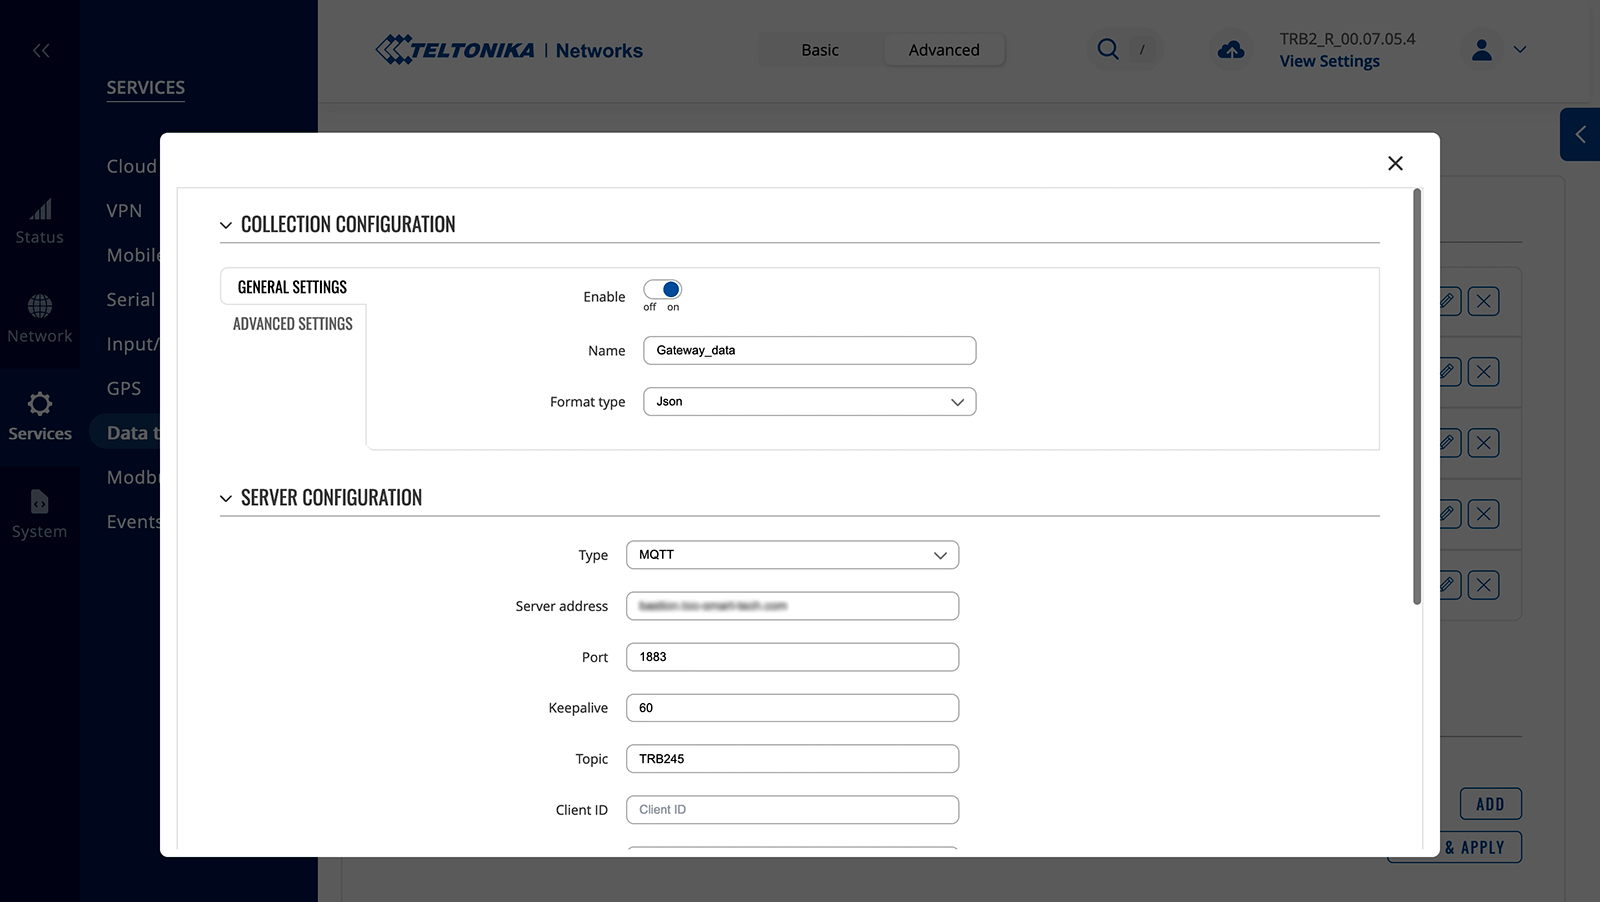
- Navigate to the “Services” -> “Data to Server” section in the web admin panel and create a new collection.
- In the “General settings” -> “Format type” field, select JSON format.
- In the “Advanced settings” -> “Period” field, specify the frequency of data requests in seconds.
- Under the “Server configuration” section, specify MQTT as the type, along with the necessary connection details to the platform, credentials, MQTT topic for publishing telemetry data messages, and other relevant settings according to your setup.
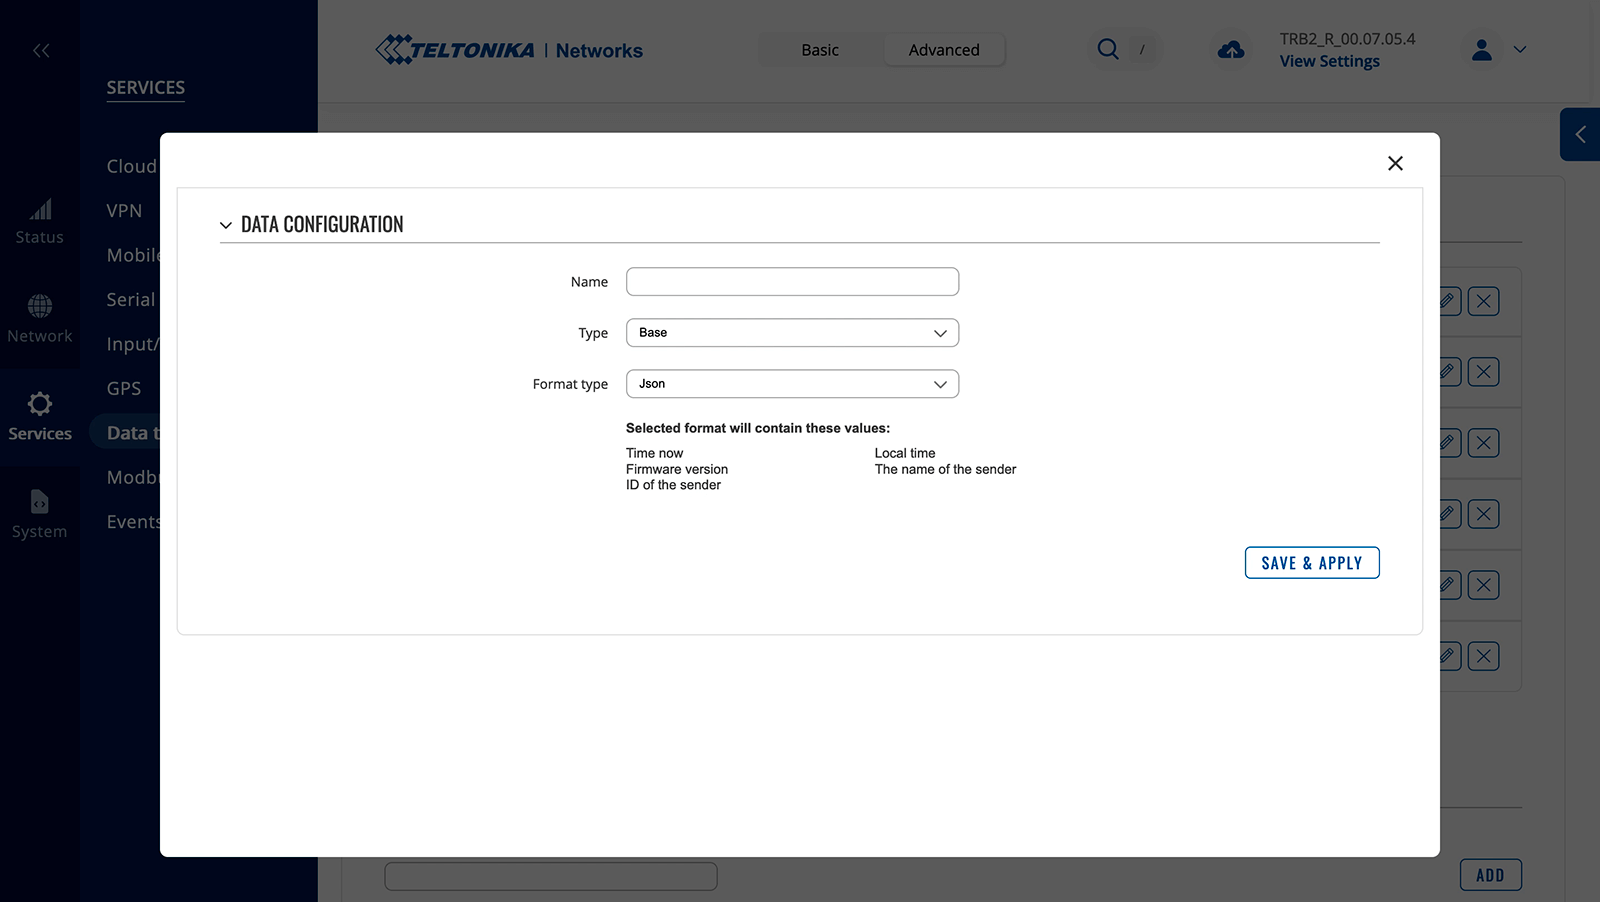
- Use the “New data input” option to add the required data to the collection.
- In the modal window that appears, specify the input name, select the desired data type from the list – for example, Base, MNF info, GSM, etc. Leave the “Format type” field as JSON by default. To include the configured requests, select Modbus as the data type.
- For this experiment, we added all available information to the collection: manually configured data, as well as pre-configured inputs for Base, GSM, and MNF.
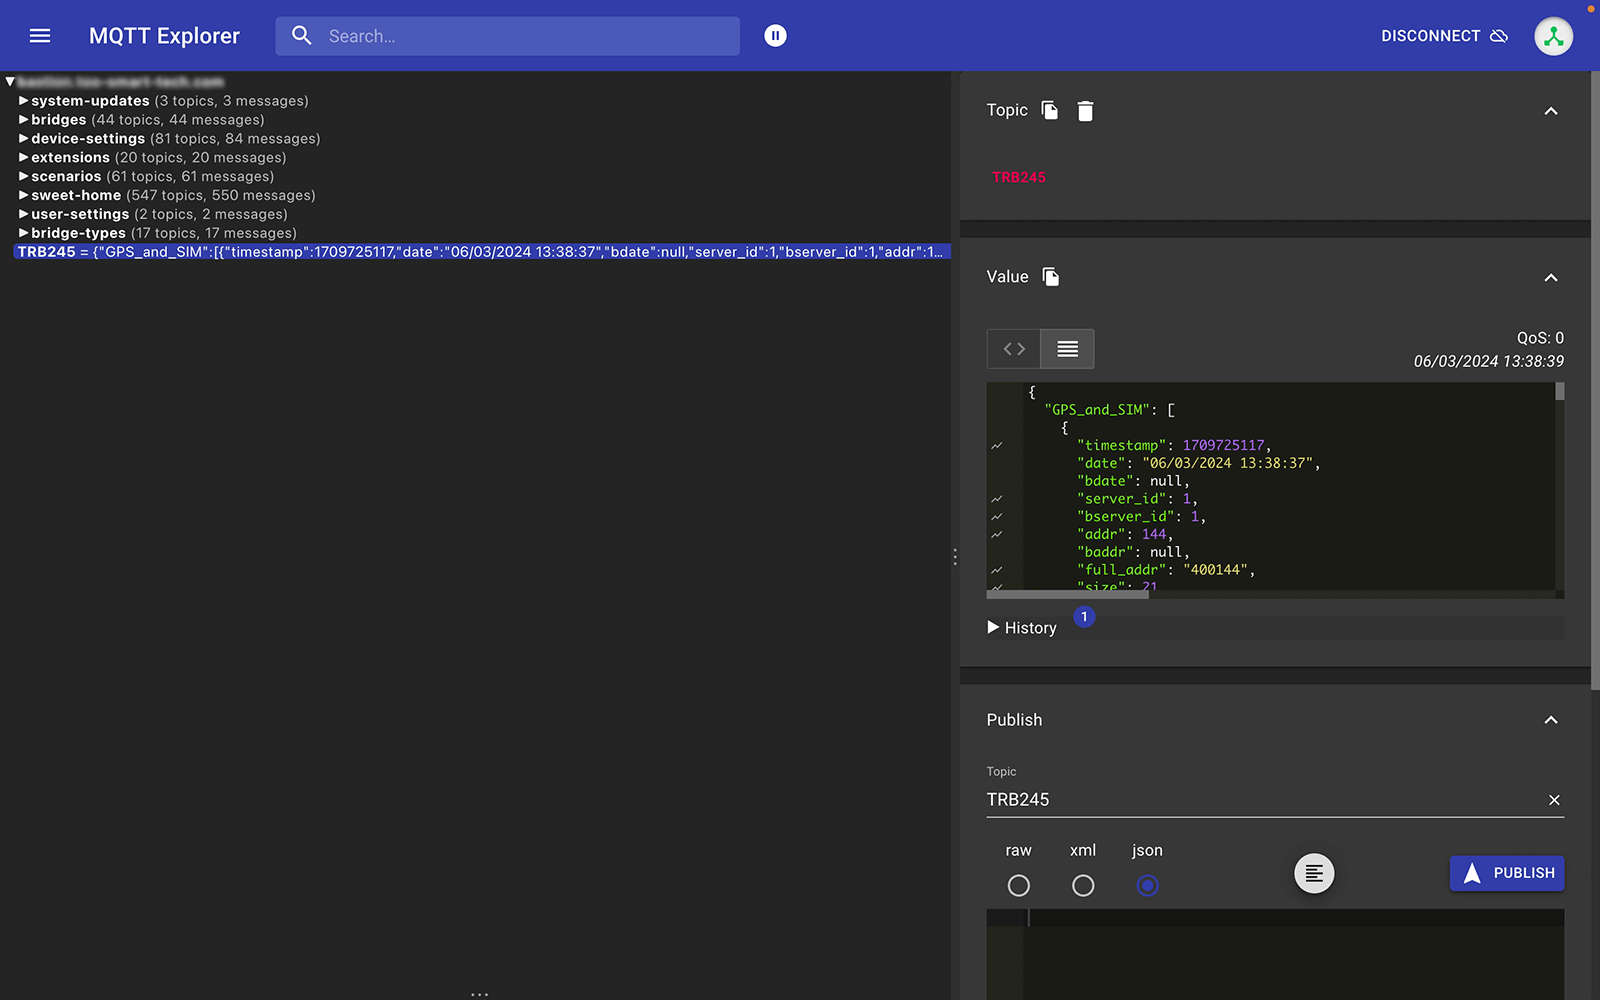
After making all the settings, we connected to the deployed 2Smart Standalone automation platform using the MQTT Explorer application to see what data the Teltonika gateway began transmitting and in what format.
We observed data from all inputs connected to the collection: separately from MNF, separately from Base, separately from GSM, and separately from Modbus.
Displaying Teltonika gateway telemetry on the 2Smart Standalone automation platform dashboard
To showcase Teltonika gateway telemetry on the automation platform dashboard, we utilized the MQTT Adapter bridge from the platform’s Market. We named this configuration “TRB245 gateway data.” After configuring all parameters, we obtained a sizable JSON file outlining the rules for the platform to retrieve the necessary data and display telemetry on the device card on the dashboard.
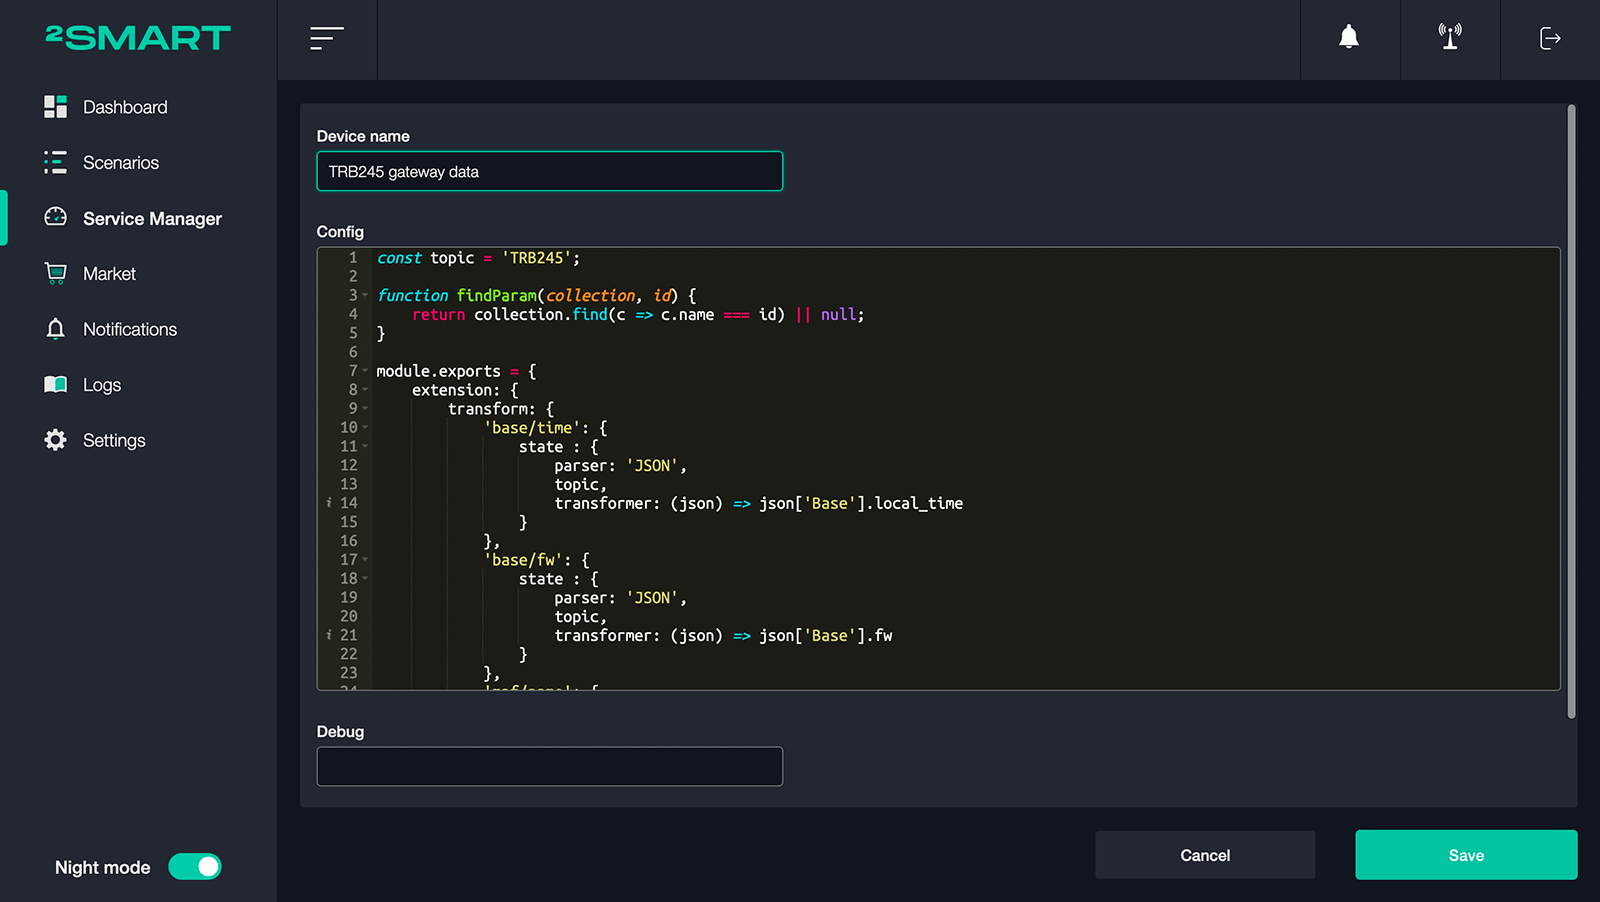
For self-configuration of the bridge, refer to its description in the 2Smart Standalone documentation. If you encounter any difficulties, feel free to contact us via the 2Smart Cloud Discussion Telegram chat. Here, we’ll focus on interpreting the metrics configured manually according to the Teltonika documentation table.
Analyzing the data received from the Teltonika gateway using MQTT Explorer and its format, we observed the following:
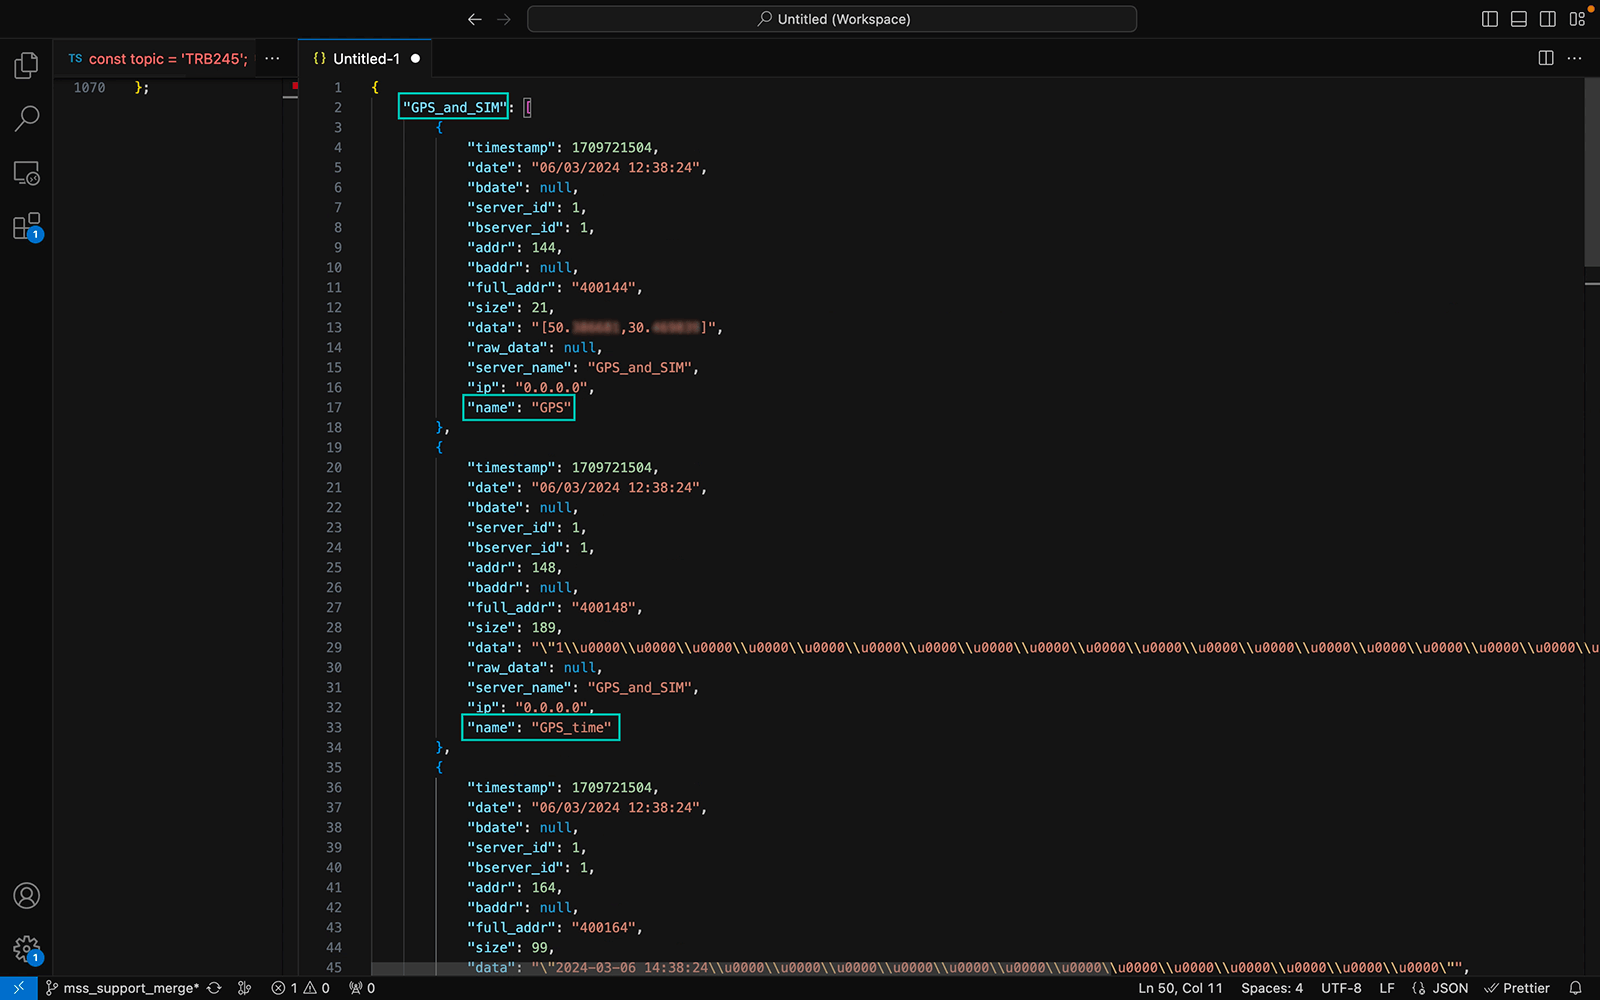
- The inputs we configured arrive separately under the names specified in the gateway’s web admin panel. For example, the manually configured Modbus input we named “GPS_and_GSM.”
- Within this input, we see all the requests we configured with the same names: GPS, GPS_time, GPS_date, etc.
- In the Data row for each of these requests, we observe the corresponding data, such as GPS latitude and longitude. If we combined data by fetching multiple values in one request, they appear in this row separated by commas. For GPS, there are two values: latitude and longitude. For Mobile_SIM2, there are 12 values representing traffic usage statistics for different periods.
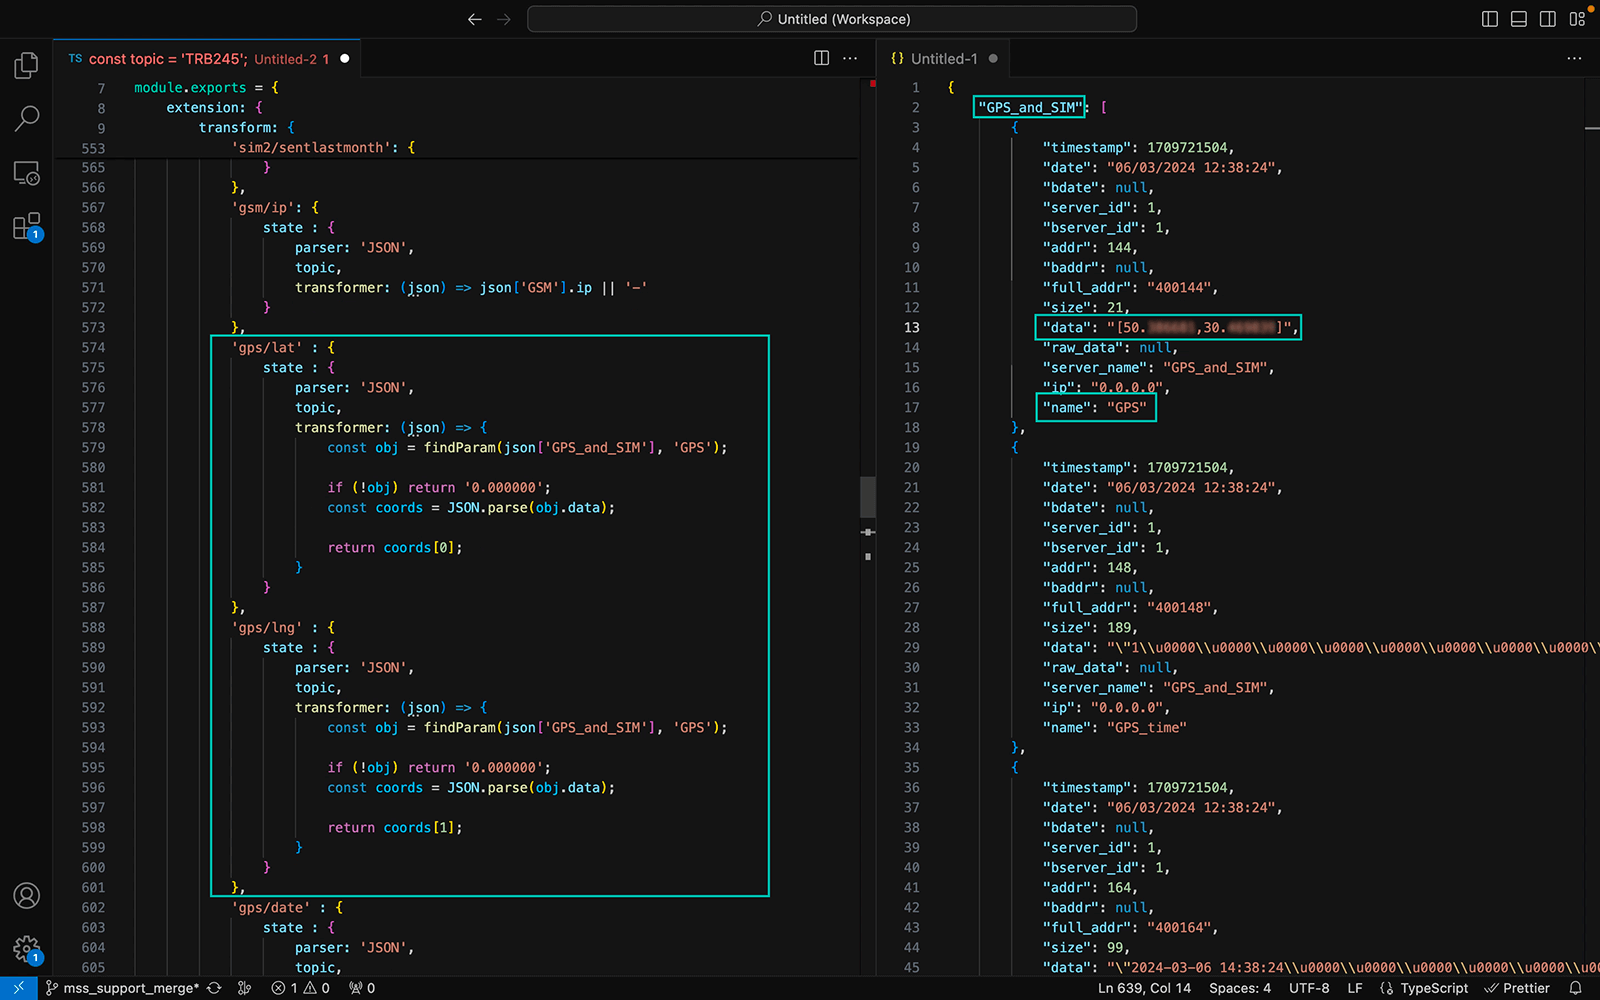
To interpret this data in the MQTT Adapter bridge configuration, we created a parser that searches for the desired parameter using a special function. If the parameter is found, the parser retrieves an array of data from the respective row. Then, it extracts the required value from this array.
Following Teltonika’s documentation, which indicates that the first (0) value in GPS coordinates is latitude, we retrieved it for the sensor with id=”lat”. The second (1) value, longitude, is retrieved for the sensor with id=”lng”. Using the same logic, we parsed all data from all objects to display them on the automation platform dashboard.
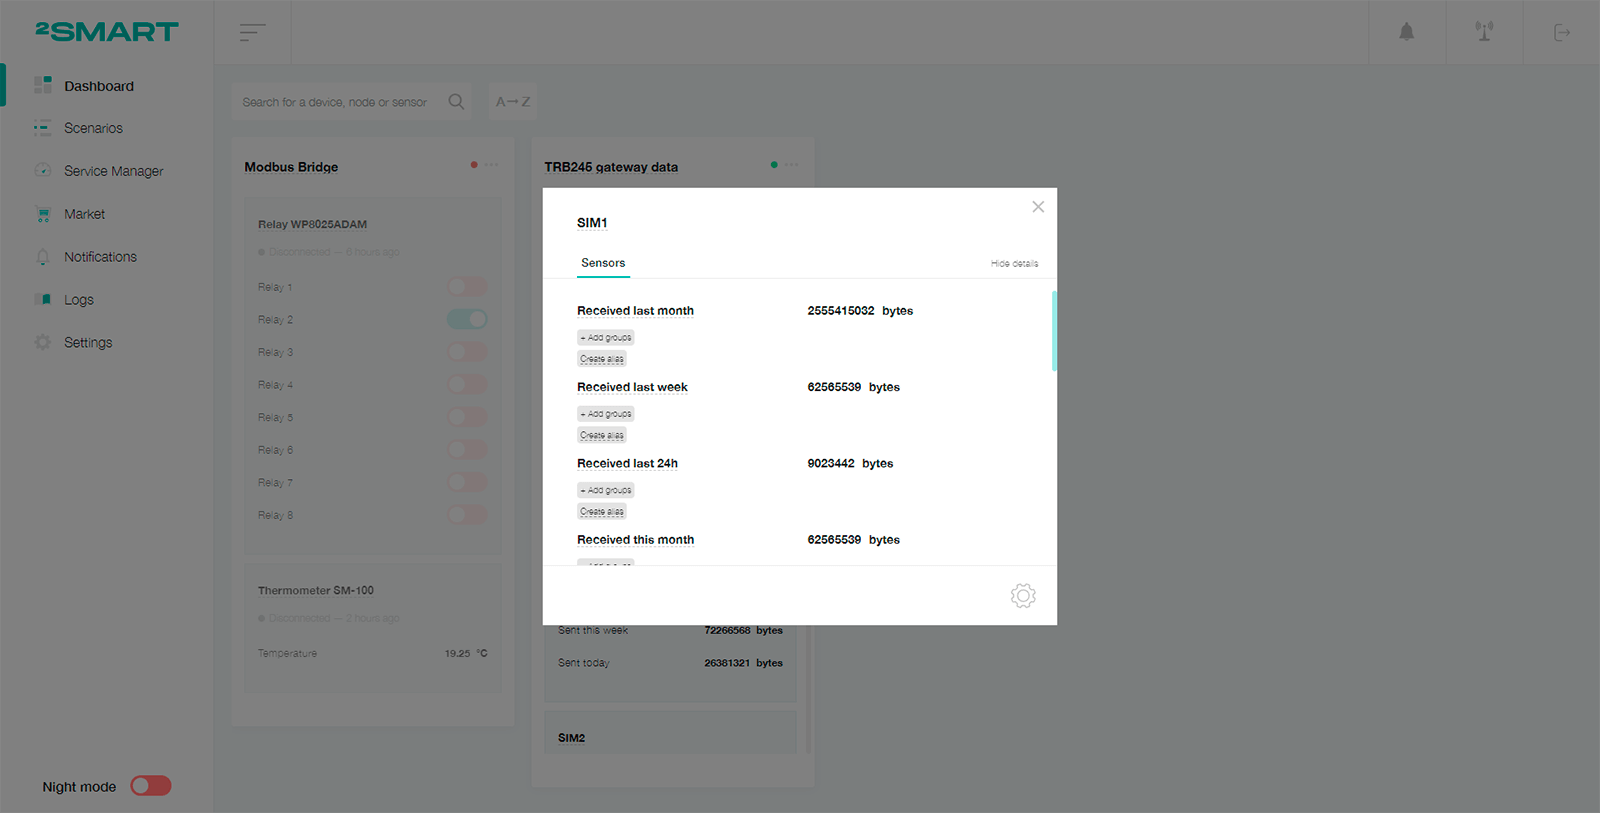
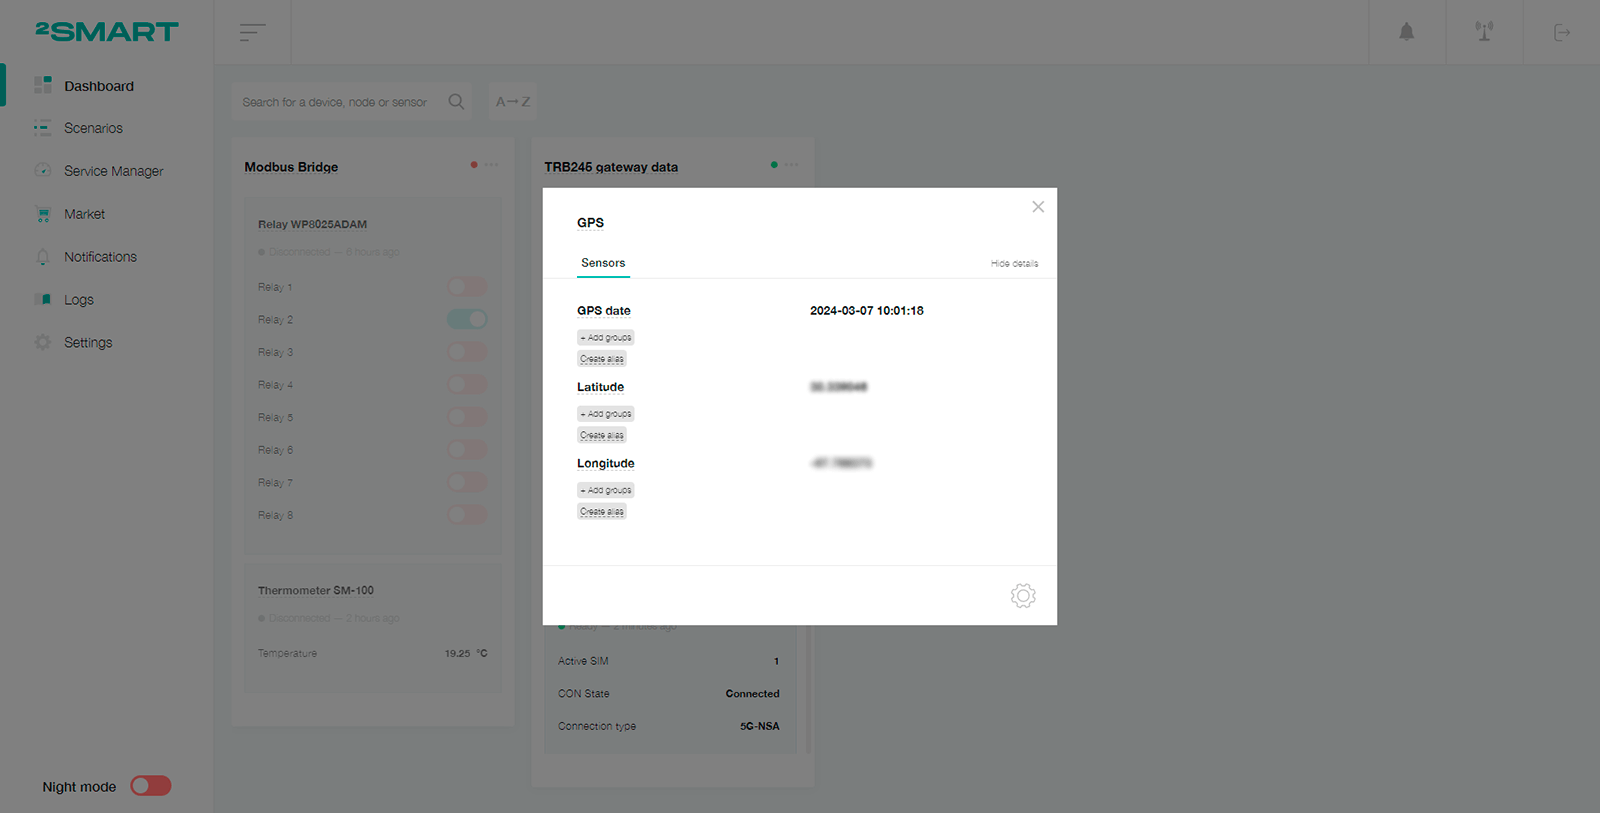
As a result, we obtained a device in the 2Smart Standalone automation platform, which card displays all the telemetry we configured earlier: basic information, MNF info, standard GPS metrics, and the collection of Modbus data we configured manually.
Thus, leveraging Teltonika gateway capabilities, we can retrieve crucial metrics in addition to Modbus device telemetry. This includes geographical coordinates and other GPS data, as well as GSM connection usage statistics.
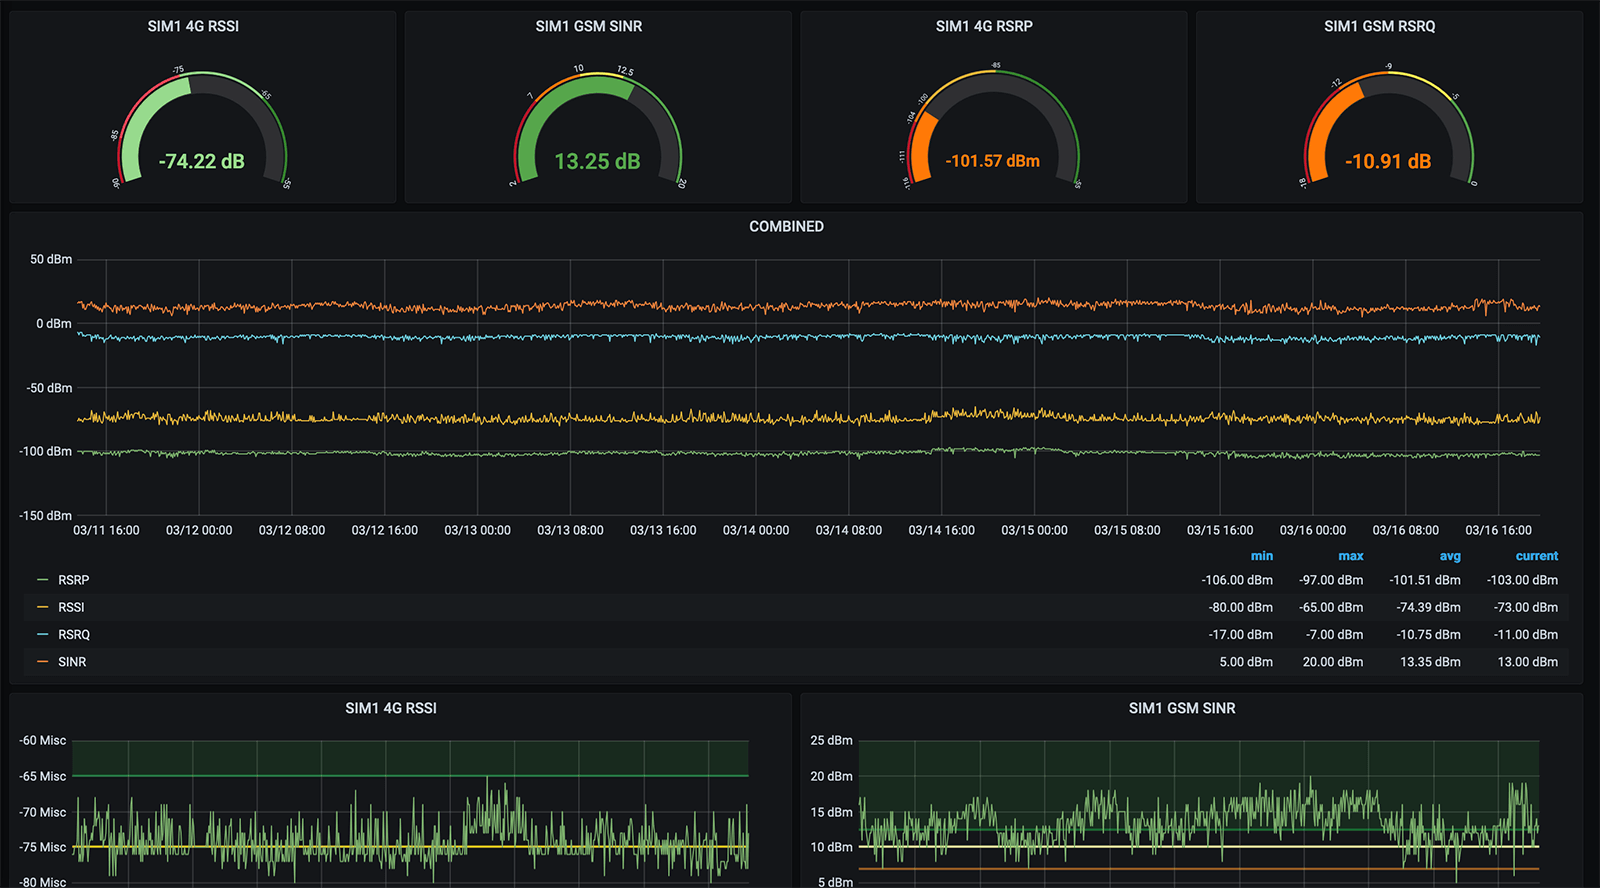
The 2Smart Standalone automation platform stores historical values of all sensors connected to it in a database, which is one of its core features. This means you can use services like Grafana to analyze this value history, set alerts for values exceeding a set threshold, or create custom automations based on this data.
If you want to learn more about the capabilities of the 2Smart Standalone monitoring and automation platform, request its demonstration with our experts: contact@2smart.com.
Don't forget to share this post!
Read Next


Let’s dive into your case
Share with us your business idea and expectations about the software or additional services.
