Table of contents:
Monitoring is an integral part of the Internet of Things technology. Connected devices and sensors continuously transmit data that require special tools to process and analyze. In addition to the data determined by the device’s purpose (the temperature value from the corresponding sensor, etc.), data that informs about the performance of the system and its security are also important. In this article, the 2Smart team shares their views on the importance of IoT device monitoring and control and talks about how monitoring the 2Smart Cloud platform and its other projects works.
Why Does IoT Monitoring Matter?
IoT monitoring matters as each device consumes resources, generate data and interacts with other devices and services. The more devices connected to a single system (learn how to connect IoT devices to the cloud), the greater the amount of data they jointly generate that must be stored on the server. Accordingly, the higher the risk is that server resources may be exhausted.
The importance of IoT monitoring is also because the failure of specific devices or sensors can lead to severe consequences, disrupting production chains.
A separate area of monitoring is the security of the system and its protection against cyber threats. IoT infrastructure security support includes update management, secure decommissioning, systems monitoring, and response capabilities.
IoT monitoring software is a tool by which businesses can understand the status of their IoT infrastructure in real-time, manage devices and sensors, and troubleshoot issues in time. By continuously monitoring the health and functionality of IoT devices and collecting and analyzing relevant performance data, companies have the information they need to ensure the security and optimal operation of the entire IoT ecosystem.
Ultimately, IoT device monitoring allows businesses to minimize the cost of device fleet management and reduce losses due to downtime when equipment breaks down. Automatic monitoring significantly reduces the share of manual labor, while eliminating the negative impact of the human factor on business processes.
IoT Data You Need to Monitor
Any IoT device collects and exchanges data with others in real-time, enabling businesses to solve problems and increase efficiency. However, connected devices also produce data you can use to check IoT device status and drill down into issues with individual instances. Early detection of these issues can help prevent downtime, crashes, and security risks.
For most companies that use the Internet of Things, the following parameters for IoT monitoring are valid:
- Resources. You need to control the use of RAM, processor or microcontroller, and disk (depending on which components are used). Resource monitoring ensures that each device is running efficiently and at optimal performance. In doing so, you must react to exceeding usage thresholds to avoid issues with individual devices that can affect the health of the entire infrastructure.
- Applications. You should also monitor the functioning of applications and processes on your IoT devices to be calm about properly operating the hardware. An IoT monitoring platform should collect real-time application performance data so that the support team can respond to alerts promptly and prevent device failures.
- Application data. The normal functioning of IoT devices implies continuous communication with other devices, as well as with the cloud or IoT gateway. Devices send sensor data and receive commands or configuration updates. Any failures in this bi-directional data transfer mean potential failures in the entire system. By monitoring the transfer of data in real-time and based on historical data, the IoT ecosystem support team can fix problems early, maintaining high system performance and avoiding financial and reputational losses for the company due to the failure of its infrastructure.
What Does IoT Device Monitoring and Control Look Like in 2Smart
Our team chose the Grafana open-source data visualization software system for the practical implementation of IoT device monitoring tasks. It is implemented as a web application with flexible options for configuring dashboards and extending basic functionality using plugins. Data in the Grafana system is displayed as charts, graphs, and tables. The alert system makes it possible to instantly receive notifications of critical events in the IoT multi-cloud ecosystem of the organization.
Visualization of historical device data
Collecting and visualizing device and sensor data is a standard task for any IoT platform. The 2Smart solution is based on the use of the InfluxDB time series database.
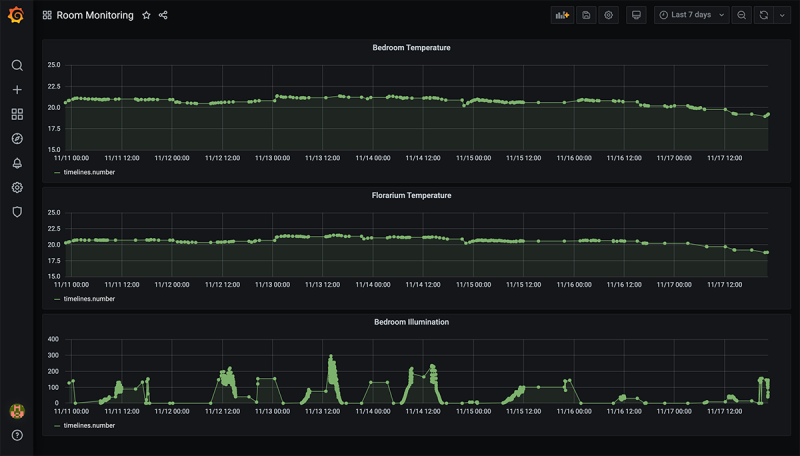
Grafana gets historical device data from InfluxDB and displays it in an easy-to-analyze form on graphs, charts, and other widgets. This allows us to configure an IoT monitoring dashboard to monitor changes in the readings of any sensors, including those responsible for monitoring IoT devices’ status. Thanks to the large Grafana community, we and our clients can use ready-made advanced dashboards that require minimal reconfiguration after deployment.
Grafana’s built-in historical analysis tools also make it possible to monitor trends and patterns in the functioning of a system or individual devices. This allows us to discover areas that need improvement and optimize the IoT system for better performance.
IoT monitoring systems in 2Smart infrastructure
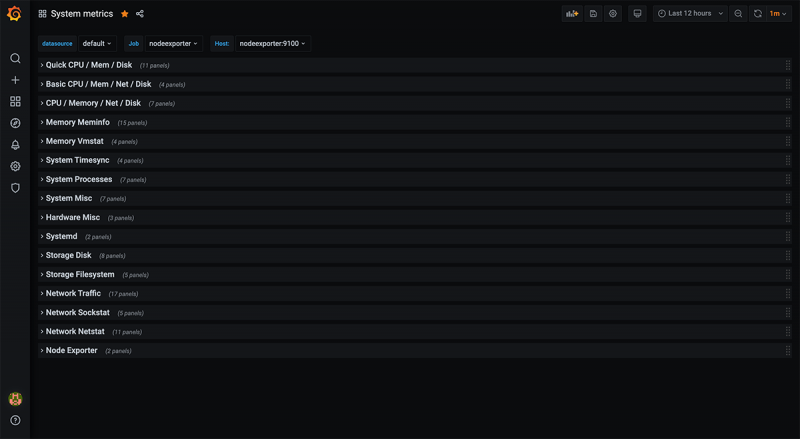
Based on best practices and our experience, our team has implemented its own IoT monitoring system template for Grafana. This template is used in such 2Smart products as the 2Smart Standalone automation system (learn how to control 2Smart Standalone devices), 2Smart Cloud IoT platform, Propuskator cloud access control system, and their white-label variations.
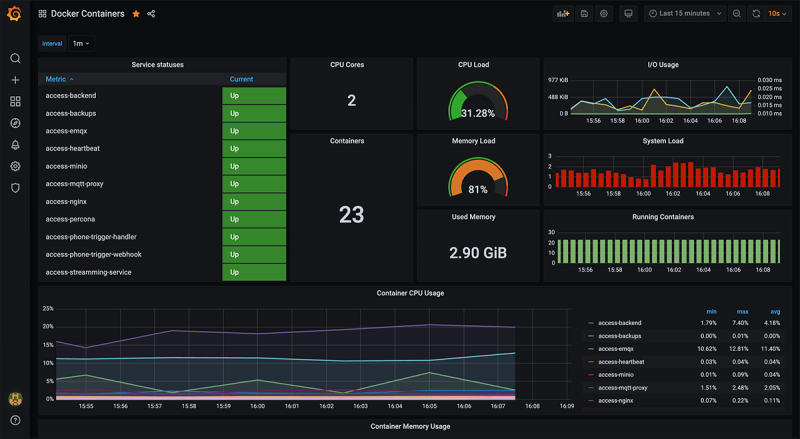
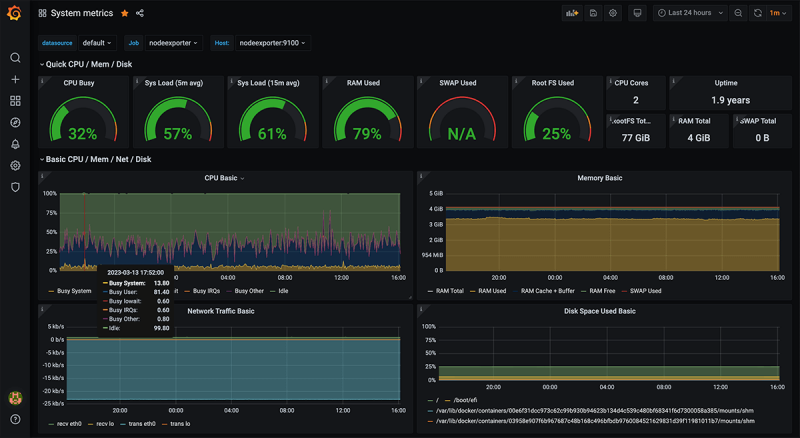
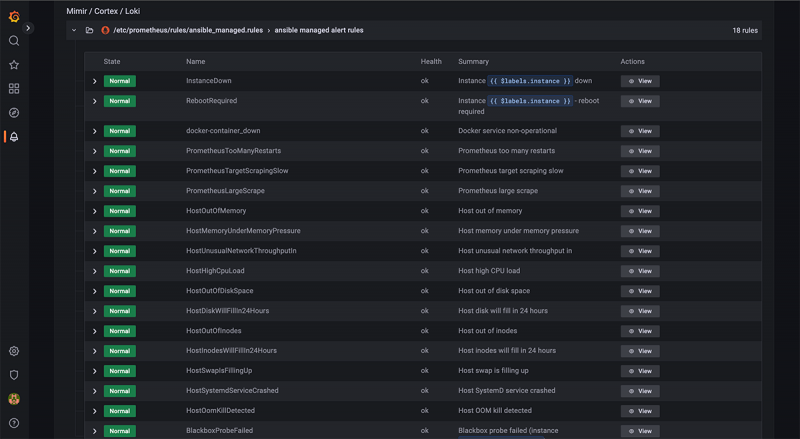
In addition to Grafana, our IoT monitoring platform includes the Prometheus monitoring system, which allows us to obtain the necessary metrics and store them in a database. We use Prometheus to store metrics related to the server’s state, Docker containers, system load, and so on.
Getting the necessary metrics from Prometheus, Grafana displays them in an easy-to-read form.
Let’s collaborate
We’re empower your business with our technology expertise
Alerting system
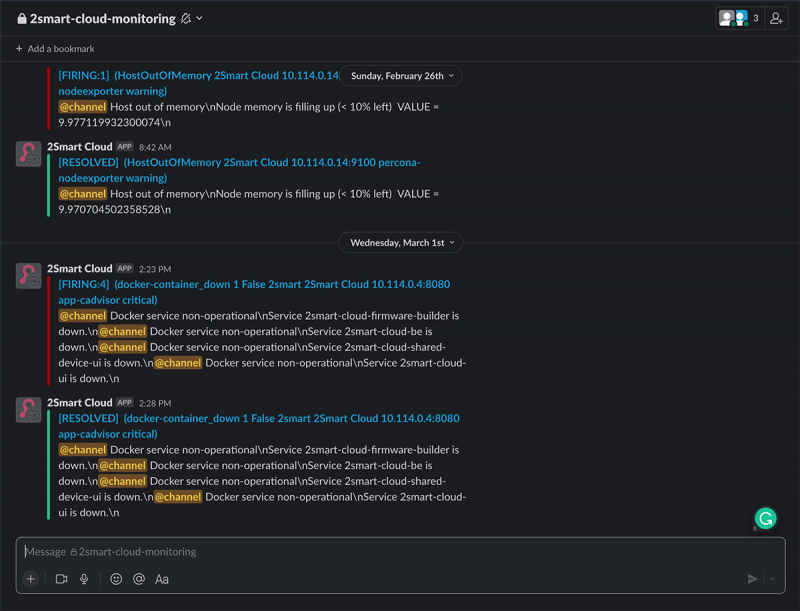
In addition to graphs, tables, and charts for visualizing data on the system’s state, 2Smart IoT monitoring implies the alerting system to respond to failures and malfunctions quickly.
For support team members to respond to alerts as quickly as possible at any time of the day, the alerting system implies integration with Slack and Telegram messengers and an SMTP client for sending messages to email.
Custom business metrics monitoring systems
Strictly speaking, business metrics are not the direction that is included in the classical understanding of IoT monitoring. However, when talking about the 2Smart IoT monitoring solutions, it is necessary to mention them.
When implementing any product our team has worked on, the question of monitoring specific business metrics has always arisen. For example, it can be registering new users in the system, specific user activity, product usage statistics, etc.
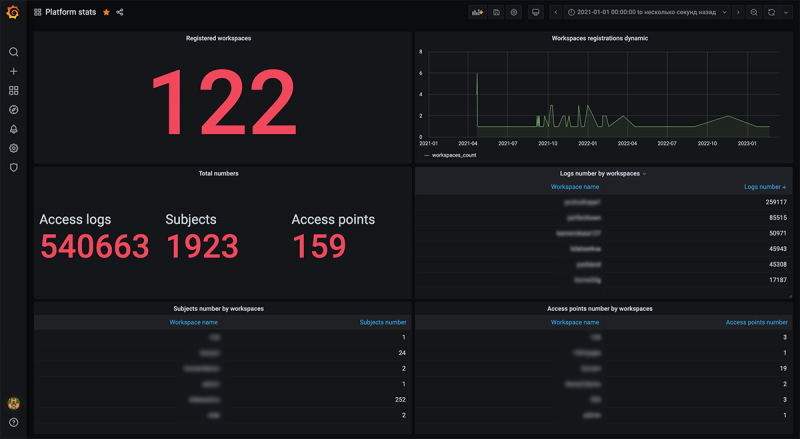
2Smart products also use Grafana to visualize business metrics. It gets the necessary data from the database of any of our products.
The business metrics tracked in this way are unique to each project. However, since most 2Smart products are distributed in white label format, pre-configured business monitoring is always included in the platform’s standard white label package. This decision increases the value of our products for customers. For example, when deploying ACS Propuskator, our clients can use business monitoring to control their own customers – ACS distributors.
Benefits of Using an IoT Monitoring Platform
An effective IoT monitoring tool allows companies to achieve the following benefits:
- Cost reduction. With IoT monitoring systems, organizations can remotely monitor and manage their IoT infrastructure and proactively troubleshoot issues, eliminating costly maintenance down the road. The end result is optimized labor and problem-solving costs.
- Equipment performance analysis. IoT monitoring allows businesses to analyze the performance and functionality of their assets. This advantage is significant if the failure of one of the devices can disrupt the entire technological chain.
- Alerts in case of failure. If the problem cannot be identified and eliminated in advance, you manage to minimize the consequences of a failure when it occurs, thanks to the alerting system. The technical support staff will receive an instant notification and start solving the problem.
- Easy scalability. IoT monitoring allows the Internet of Things infrastructure to grow with the company. It makes deploying and managing connected devices more manageable and provides complete visibility into the entire fleet of devices, no matter where they are located.
- Convenient display of aggregated data. You cannot manually manage a fleet of hundreds or thousands of IoT devices. However, thanks to the IoT monitoring system, you can see aggregated data about the system’s state as a whole.
- Efficiency improvement. As remote monitoring and management tools simplify IoT maintenance, teams have time to focus on more business-critical tasks and improve workflows. Developers, for example, can devote their attention to innovating and developing new features for the company’s products.
- More satisfied customers. IoT monitoring enables organizations to implement proactive IoT device management. This means performance and security issues can be resolved before they impact customers. As mentioned, IoT monitoring also helps teams focus more on core business initiatives, such as introducing new product features, which in turn also leads to higher customer satisfaction.
Bottom Line: IoT Monitoring Ensures Your Organization’s IoT Infrastructure is Running Efficiently
Today’s enterprise IoT ecosystems are complex and are predicted to continue to grow in complexity and scale. Each IoT device generates vast amounts of data and transmits it to the system. Due to a single software error or hardware failure, the system can experience a cascade of problems that will significantly damage business processes and the company’s reputation.
With IoT monitoring, you can avoid undesirable developments by proactively detecting and fixing performance issues before they affect your business.
In addition, IoT monitoring increases your company’s productivity and reduces manual labor and costs. To learn more about IoT monitoring capabilities in 2Smart solutions, please get in touch with our team.
Don't forget to share this post!
Read Next
Let’s dive into your case
Share with us your business idea and expectations about the software or additional services.


