
Table of contents:
Collecting and storing historical sensor data plays a crucial role in the Internet of Things, as it allows optimizing system operations, improving efficiency, and enhancing security. It should be a core functionality of any cloud IoT platform or home automation platform. This article continues the series on using Modbus devices with the Teltonika gateway in conjunction with the monitoring and automation platform, 2Smart Standalone. Using this device set as an example, we demonstrate how the built-in functionality for storing historical sensor values works within our software and how to launch a dashboard with the necessary graphs and tables.
Why collecting and storing historical sensor data in IoT matters
Let’s explore the five key reasons why collecting and storing historical sensor data plays a crucial role in the Internet of Things.
Analytics and Prediction
Historical data enables the analysis of past system behavior, identifying trends, patterns, and anomalies. This aids in predicting future events, enhancing system efficiency and reliability, preventing potential issues, and making informed strategic decisions.
For instance, you can detect periods of increased or decreased resource demand, seasonal variations in energy usage, or other characteristics useful for optimizing system operations.
Resource Optimization
Analyzing historical data allows for the optimization of resource usage, such as energy, time, and materials. Based on this information, more efficient resource management and utilization strategies can be developed, leading to increased production efficiency and achieving environmental sustainability.
For example, based on historical energy consumption data, future changes can be forecasted and production processes can be adjusted accordingly. Sensor data analysis in a production line can help identify optimal equipment operation parameters and reduce the amount of defective products.
By reducing energy, water, and other resource consumption, emissions of pollutants can be minimized, and the environmental footprint of production can be reduced.
Performance Improvement
Studying historical data helps identify weaknesses in the system and take measures to improve them. This can help increase system performance, reliability, and quality of operation, as well as reduce the likelihood of failures.
For example, sensor data analysis can identify areas where frequent failures or malfunctions occur, allowing measures to be taken to address them and improve the overall system reliability. Based on such analysis, optimal equipment or process operation parameters can be identified, leading to increased performance and reduced cycle time.
Sensor data analysis can indicate precursors to the failure of certain devices or components, allowing measures to be taken for their replacement or repair before a critical situation occurs. It also helps identify factors influencing the defect rate and provides an opportunity to take measures to improve them.
Machine Learning Model Training
Historical data serves as the foundation for training machine learning models, which can be used for process automation, event forecasting, and making informed decisions.
For example, based on historical data on temperature, humidity, and other weather parameters, a model can be trained to forecast the weather based on current conditions. Another model may predict demand for specific products or services based on data from previous purchases.
Additionally, a model can analyze data from manufacturing processes and suggest optimal equipment settings to achieve maximum productivity. Lastly, a machine learning model can automatically optimize resource allocation or manage production processes to achieve optimal results.
Security Assurance
Studying historical data allows for the identification of threats and attacks on the system, as well as the development of methods to prevent them. This helps ensure the security of the Internet of Things system and protects data from unauthorized access.
For example, deviations from the typical behavior pattern of the system or sensors may indicate a potential cyber attack or other forms of attack. By using historical data to build threat forecasting models, these models can predict possible entry points for cyber attacks or potential accident locations.
Let’s collaborate
We’re empower your business with our technology expertise
Analysis of historical sensor values from Modbus devices connected via Teltonika gateway in 2Smart Standalone
Collecting and storing sensor values is one of the basic features of the 2Smart Standalone monitoring and automation platform. This software starts recording such data immediately after deployment and connection of devices to it. No additional actions from the user, such as enabling this feature in the admin panel, are required. To store the history of sensor values from connected devices in 2Smart Standalone, a special service based on the time series database InfluxDB is used.
However, viewing and analyzing the history of sensor values by default in the automation platform is not enabled; it requires 15 minutes to set it up. Here are the steps to take:
- Install the Grafana add-on from the built-in Market.
- Configure a dashboard inside Grafana with tables, graphs, or charts displaying the values of selected sensors.
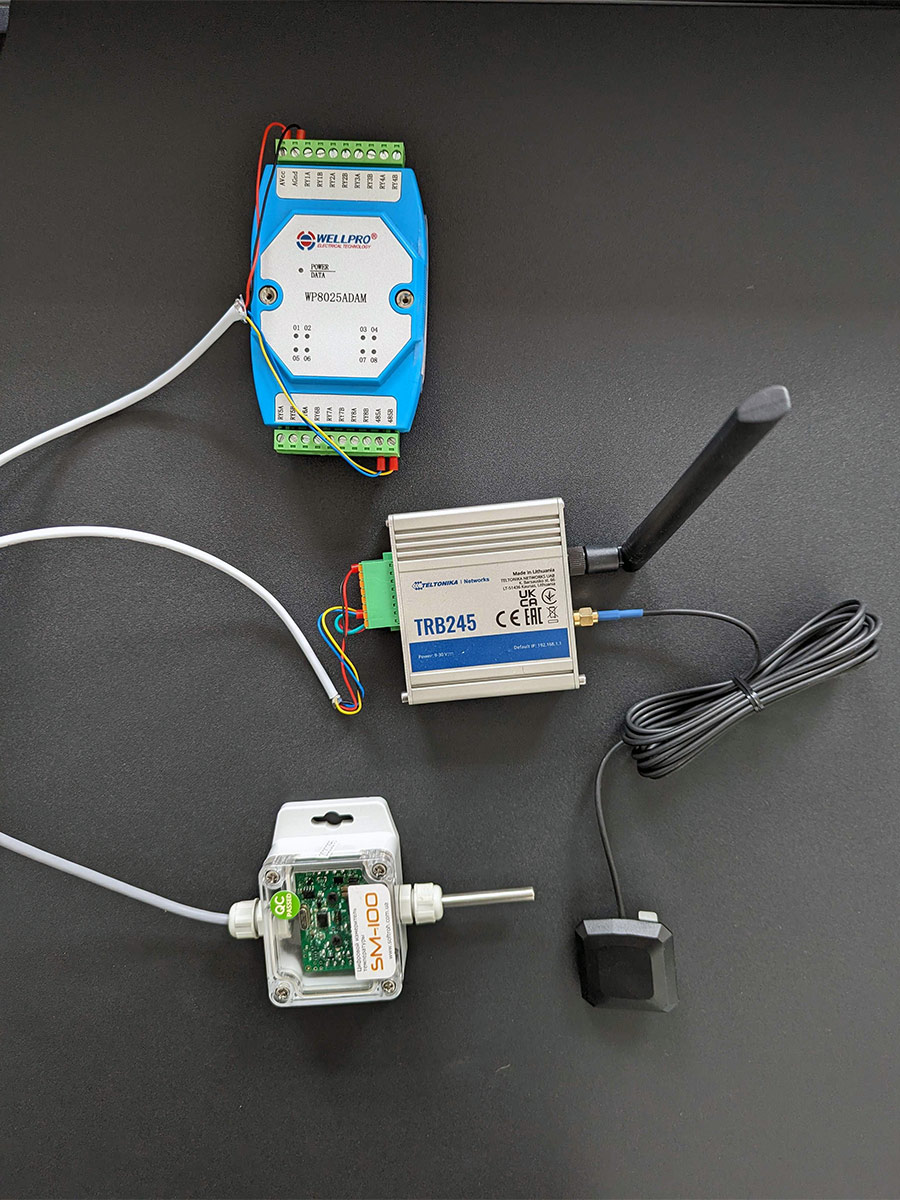
Let’s delve into how it works in detail. We’ll be using the same set of devices we’ve previously discussed in our blog: a Modbus bus consisting of a Teltonika TRB245 gateway, a temperature sensor, and an 8-output relay. This bus is connected to an instance of the 2Smart Standalone automation platform, where an embedded bridge is used for Modbus protocol interaction, essentially serving as the bus master. In this setup, the Teltonika gateway acts as a proxy, forwarding requests from the bridge to the relays and sensors as slaves on the bus.
The Modbus bridge of the platform connects to the gateway via an IP address and then interacts with the devices. Thanks to the use of OpenVPN, the communication between the automation software and physical devices occurs remotely, from the cloud. In our case, the 2Smart Standalone instance is deployed on a DigitalOcean droplet, so access to the platform’s web admin interface and interaction with the devices are possible through a browser from anywhere on the planet.
Collecting sensor values
To work with sensor values history, it’s necessary to accumulate it. With temperature sensor values, it’s straightforward — as long as the sensor is powered on and connected to the gateway, its readings will change and be recorded in InfluxDB. However, with relays, we can only gather a history of their states (true or false). Therefore, we’ve set up automation scenarios to accumulate such history over several days without human intervention.
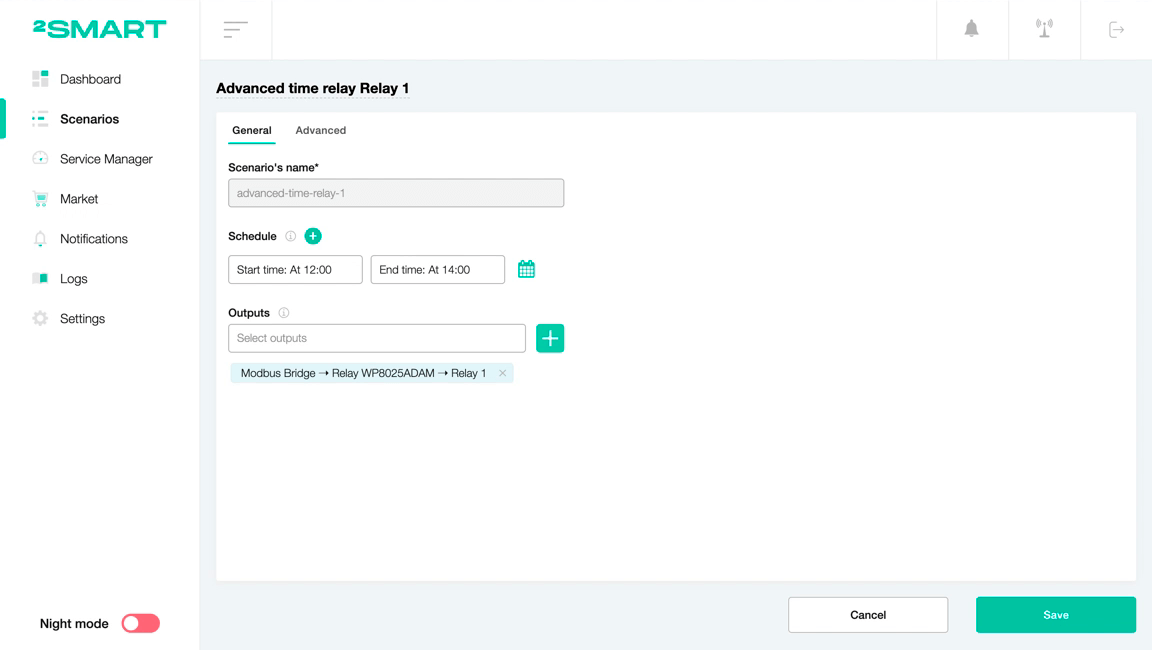
For Relay 1 output, we configured an “Advanced Time Relay” scenario that turns the relay on and off at specific times daily. We set the window between 12:00 and 14:00 UTC for Relay 1 output to be on.
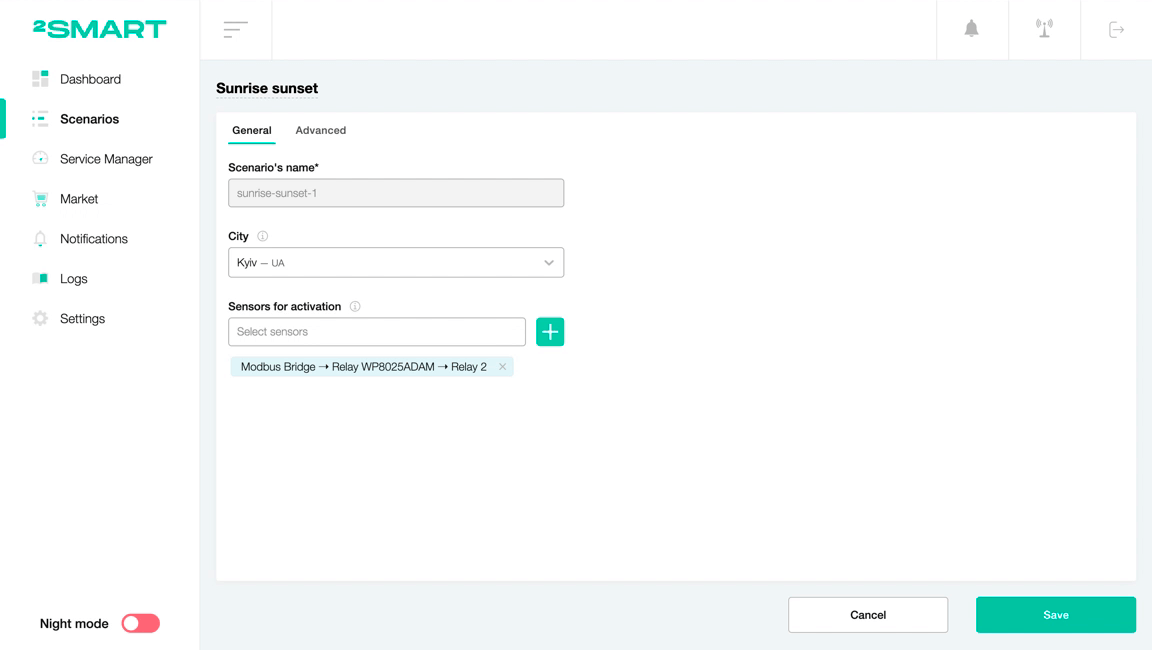
To control Relay 2, we set up a different scenario called “Sunrise Sunset.” Here, it’s sufficient to specify your city, and the scenario calculates the sunrise and sunset times for the current date, triggering the specified action. In our case, this action involves toggling relay output.
Installing Grafana and configuring the dashboard
Now that the sensor data history is accumulating, it’s time to install and configure the Grafana data visualization system. Here’s what you need to do:
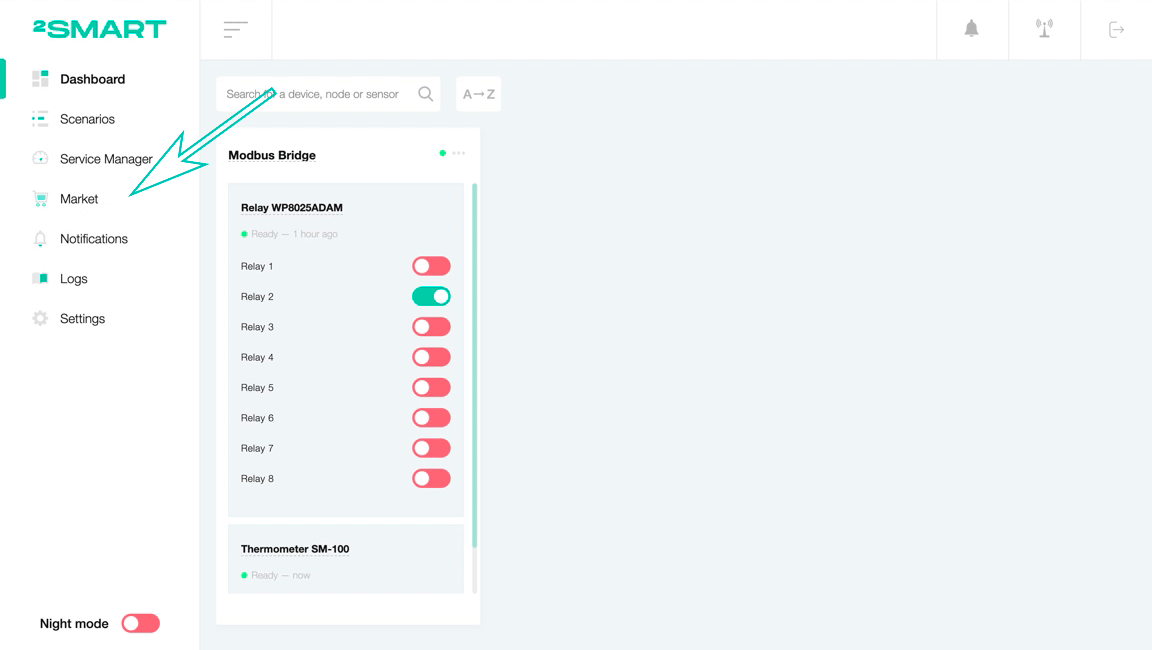
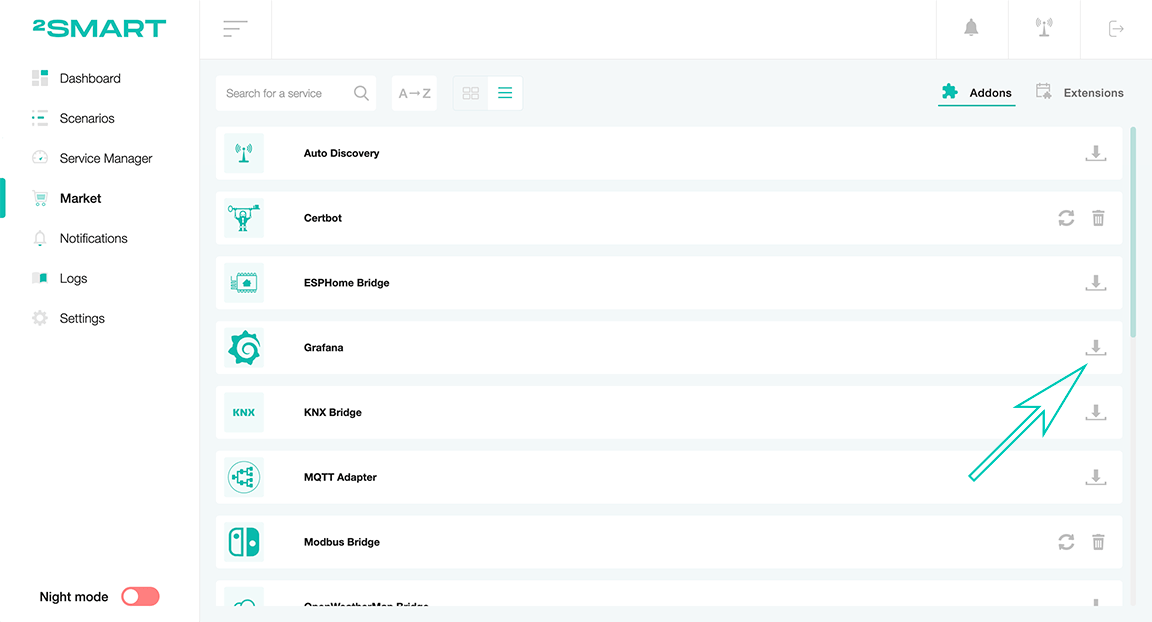
- In the 2Smart Standalone admin panel, navigate to the Market.

- Choose Grafana from the list and click the addon installation button.

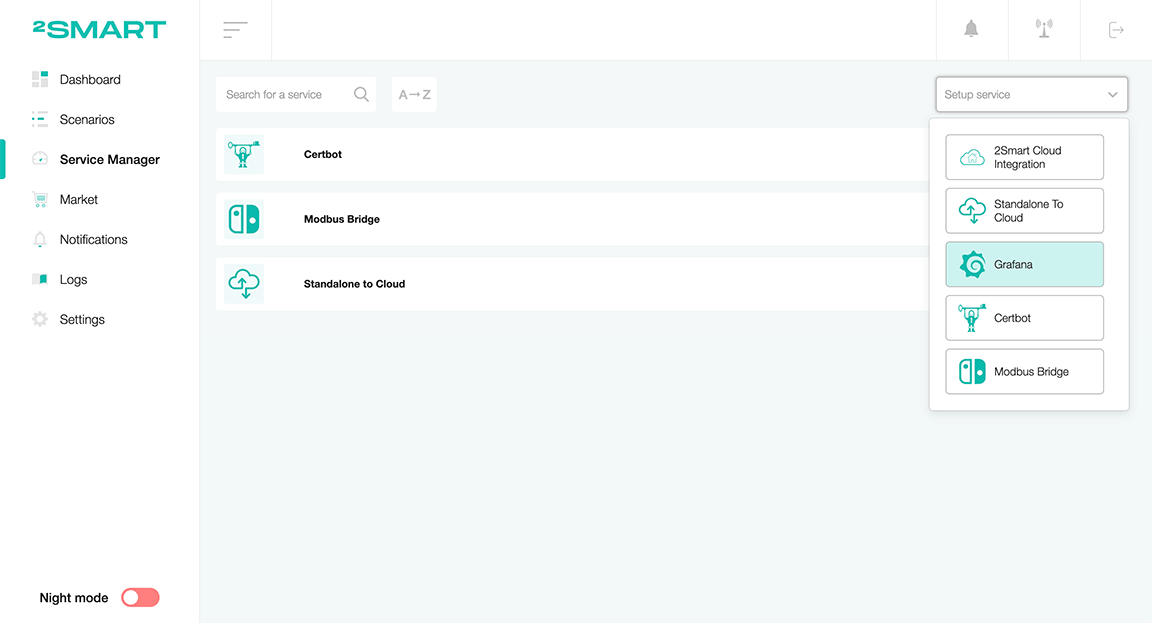
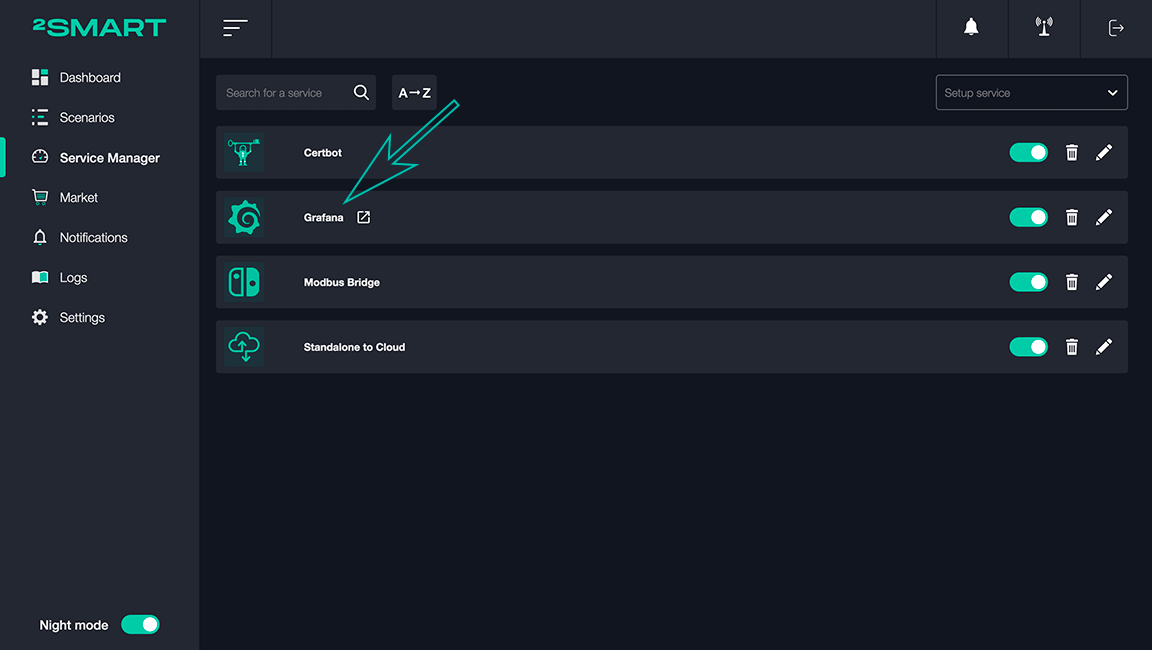
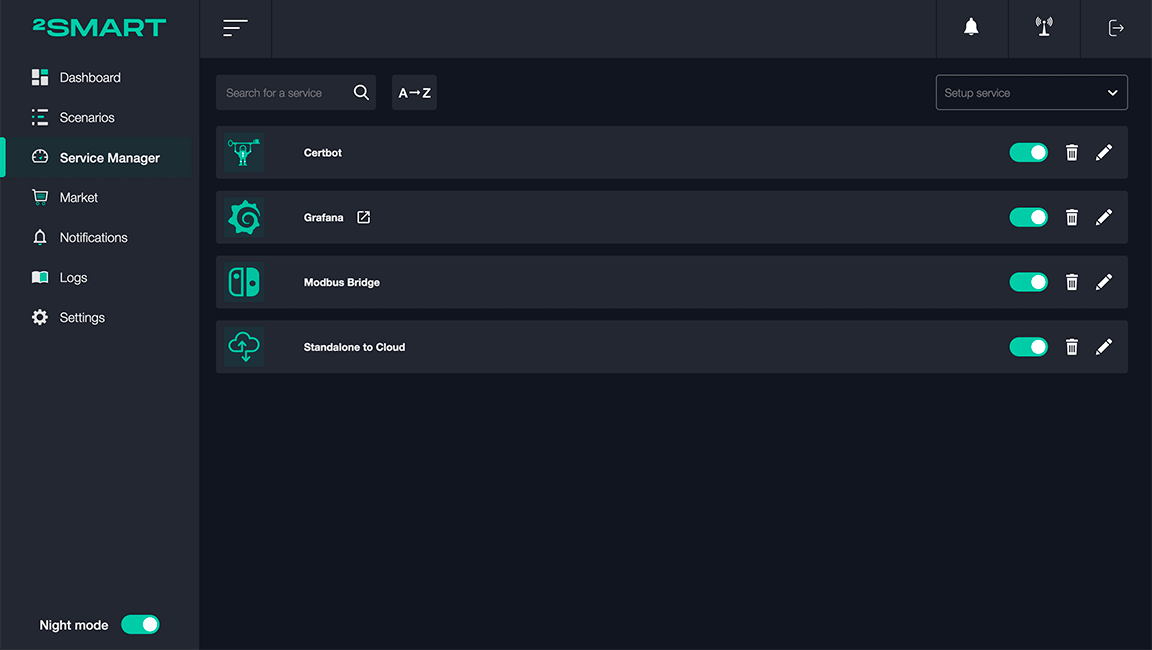
- After installation, go to the Service Manager section, click on the “Setup service” list, and select Grafana.

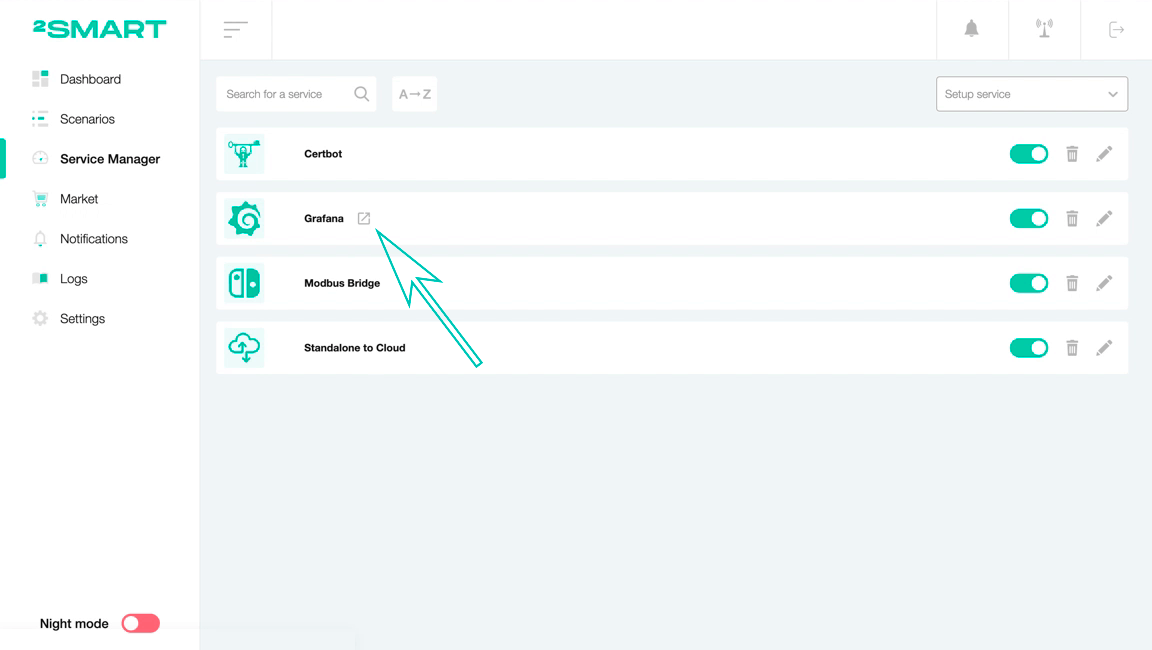
- Once the Grafana line appears on the Service Manager page, click on the external link icon next to the line name to access the Grafana web application.
- In the Grafana web application, configure widgets (tables, charts, graphs, etc.) with the required sensor values from devices connected to the automation platform.
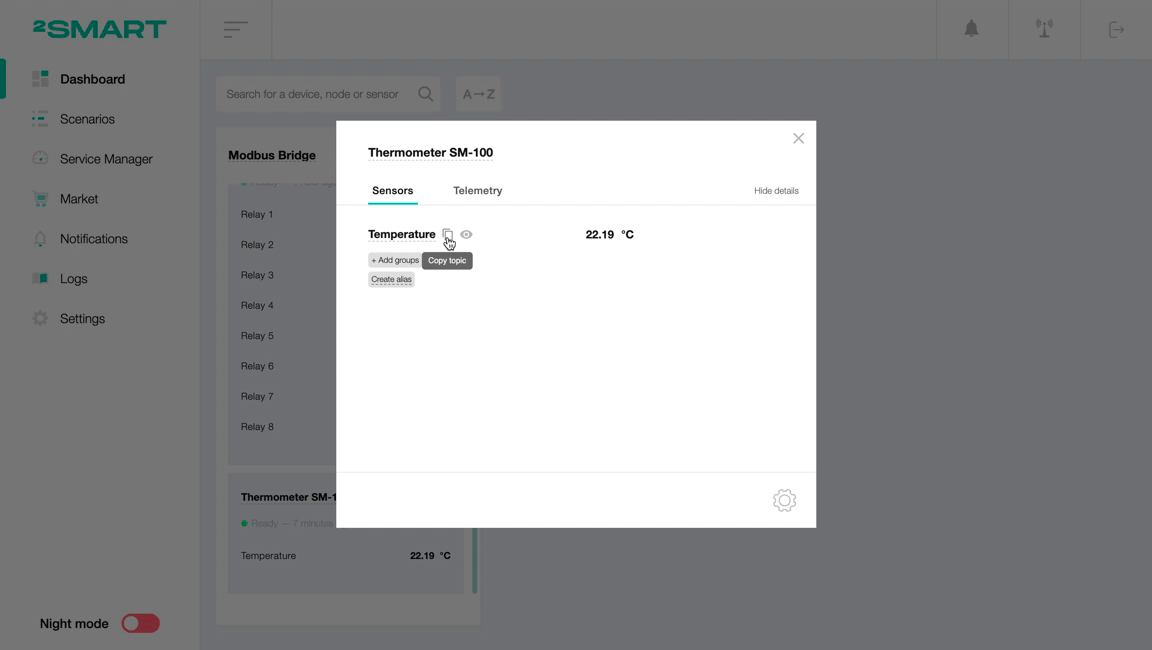
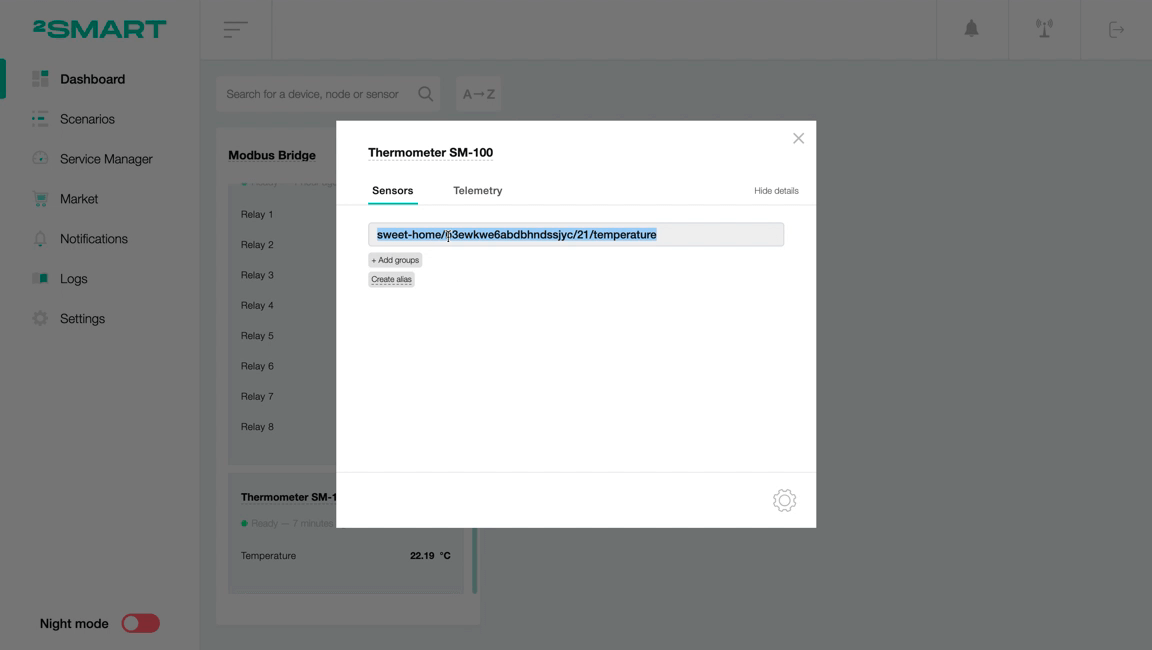
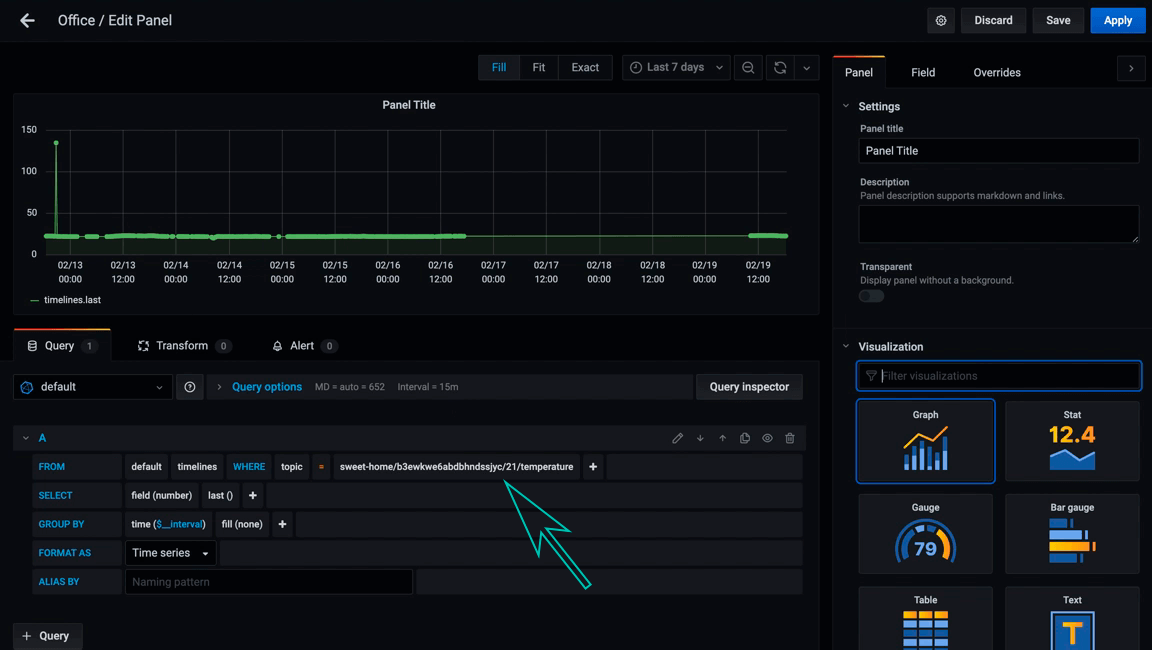
When configuring widgets in Grafana, refer to its official documentation for a detailed description of all fields. We will focus specifically on the “topic” field, where you need to specify the MQTT topic of the sensor whose values you want to display using this widget.
To obtain the topic, go to the dashboard of the 2Smart Standalone admin panel, select the desired device, and click on the name of the corresponding sensor. In the modal window that appears, hover over the sensor name and click on the “Copy topic” icon. Then, simply paste the copied path into the widget settings in Grafana.
Results
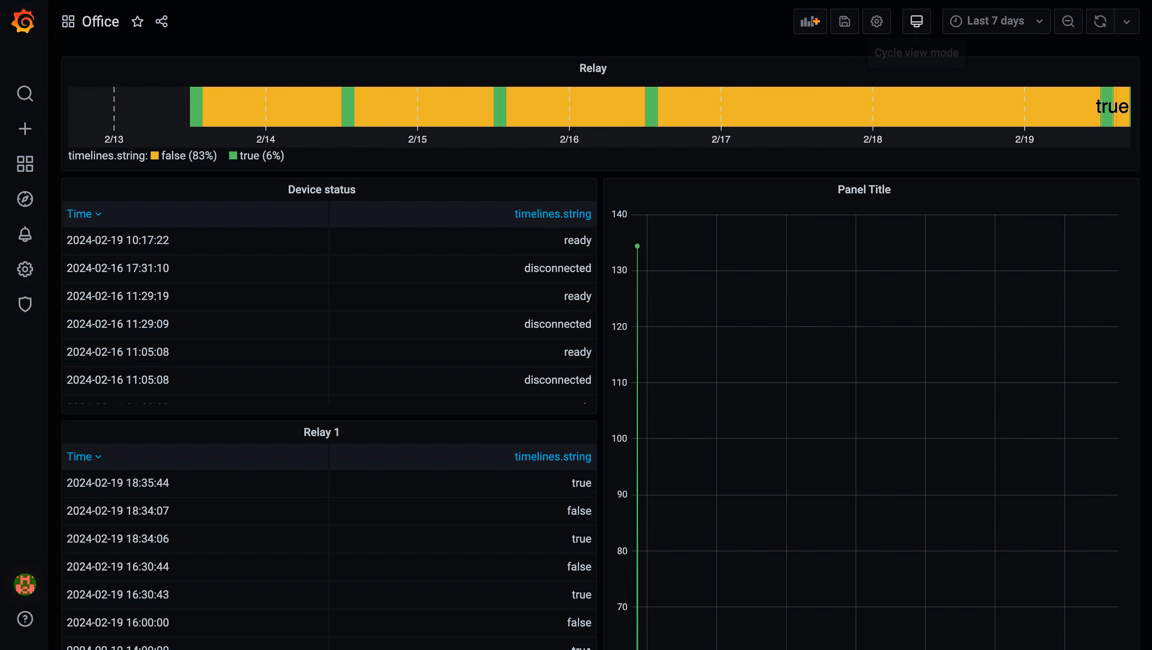
Here is how the dashboard we configured looks like for analyzing the historical values of the state of Modbus device sensors, connected to the 2Smart Standalone automation platform via the Teltonika gateway.
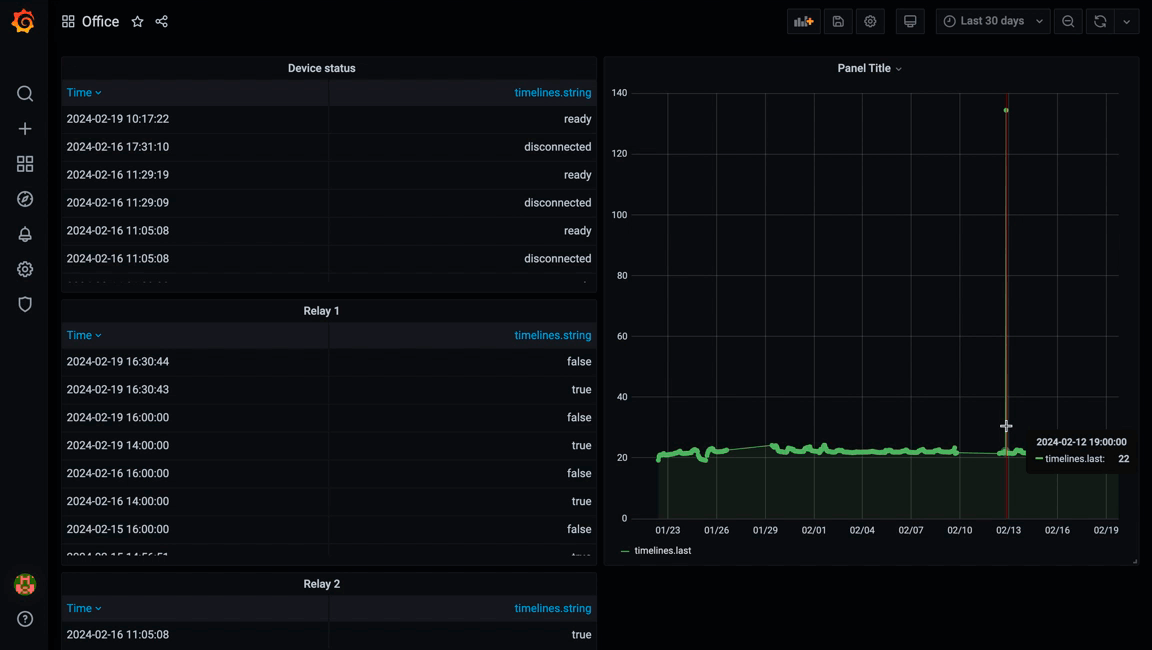
Initially, we added four widgets:
- Table with the history of device status changes (overall availability of the Modbus bus).
- Table with the history of Relay 1 state changes.
- Table with the history of Relay 2 state changes.
- Graph showing temperature sensor value changes.
It is noteworthy that in the table with the Relay 1 state values, we can see that it turns on daily at 14:00 and turns off at 16:00, although we configured the interval between 12:00 and 14:00. It is important to consider that the automation platform is deployed on a cloud server, where the UTC±0:00 time zone is used, while our company is located in Kyiv, where the UTC+2:00 time zone is applicable during winter. This is the two-hour difference we obtained. This should be taken into account when configuring automation scenarios.
Of course, the same table takes into account the time intervals when the relay was manually turned on and off.
Additionally, we observed an anomalous value on the temperature change graph, which turned out to be a result of hardware malfunction. Thanks to the analysis of the data history, this issue was detected.
Additional features for complex cases
We’ve configured a very simple example dashboard with just four widgets. When connecting a large number of devices, it makes sense to create multiple dashboards in Grafana, using the logic that best suits your tasks. For example, you can distribute sensor values across different dashboards based on the type of sensors, the installation location of devices, the functionality of devices, or the configured time intervals.
The 2Smart Standalone platform allows you to create professional scenarios – custom ones that are not available in the built-in Market. Among the capabilities that the platform administrator gets in this case is the ability to work with the InfluxDB API to retrieve historical data from there and use it for more complex and flexible automations than those possible by default. For example, you can rely on accumulated sensor value history to automatically detect anomalies in current readings or adapt to changing conditions.
Let’s collaborate
We’re empower your business with our technology expertise
Bonus: How to add a new plugin in Grafana
If you want to add a new widget or another plugin to your Grafana instance associated with the 2Smart Standalone automation platform, you may have some questions even when using the official documentation. To resolve them, we’ll show you how to do it below.
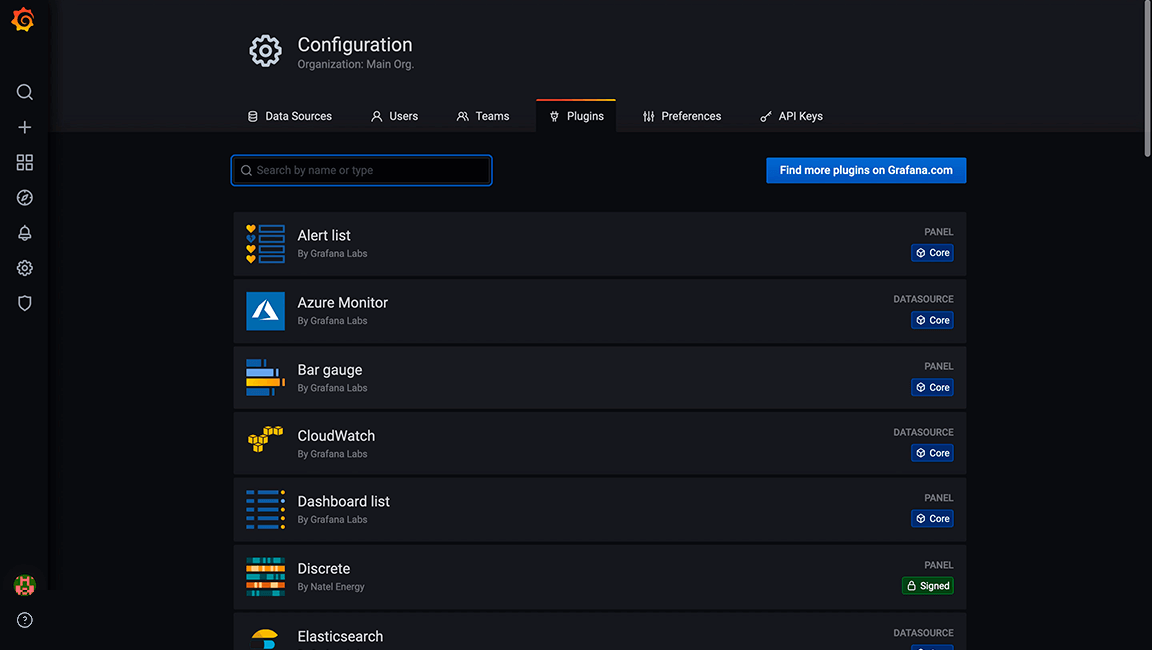
Let’s say we need to install the Discrete plugin, which allows using the corresponding widget on the dashboard to display the history of boolean or string sensor changes. Here’s how to do it:
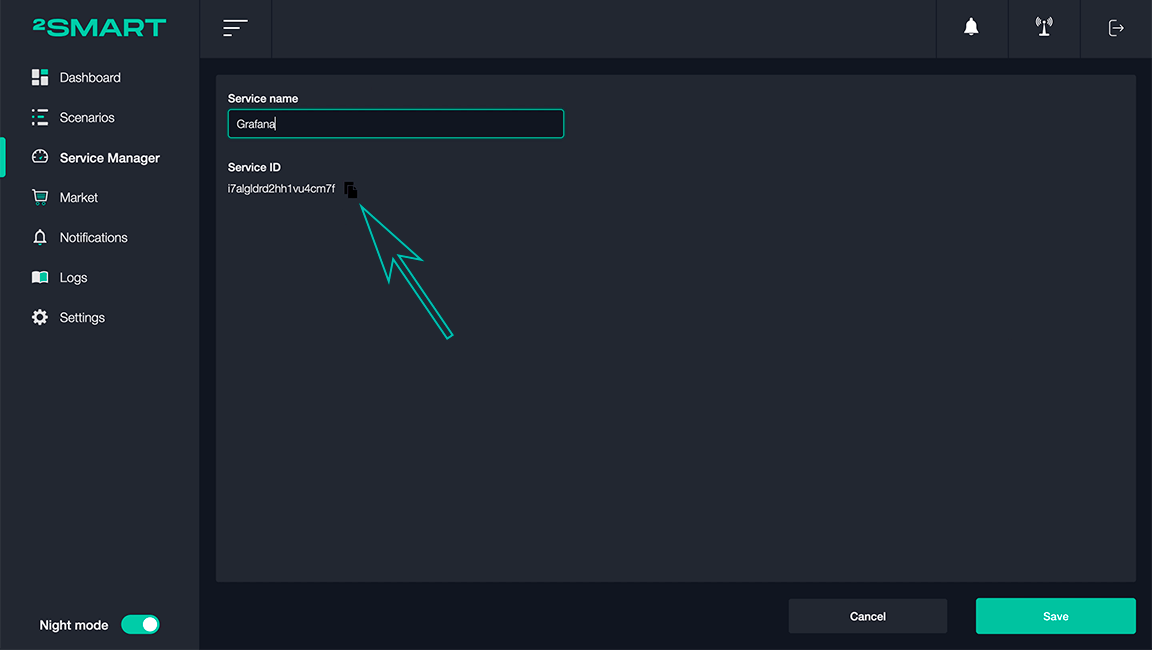
- In the 2Smart Standalone admin panel, go to the Service Manager section, find the Grafana row, and click on it.
- Copy the Service ID value using the icon to the right of it.
- Use the terminal to log in to the server where your 2Smart Standalone instance is running.
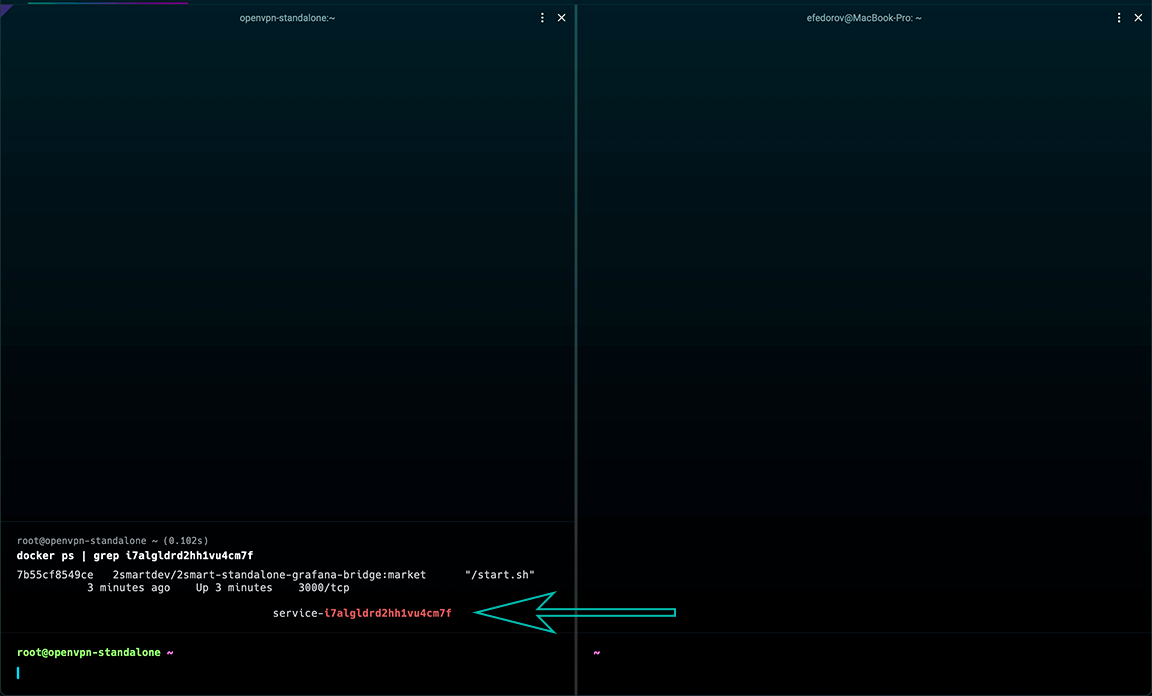
- Find the Docker container with the copied Service ID. To do this, enter the following command:
docker ps | grep <service-id>
Copy the name of the found container.

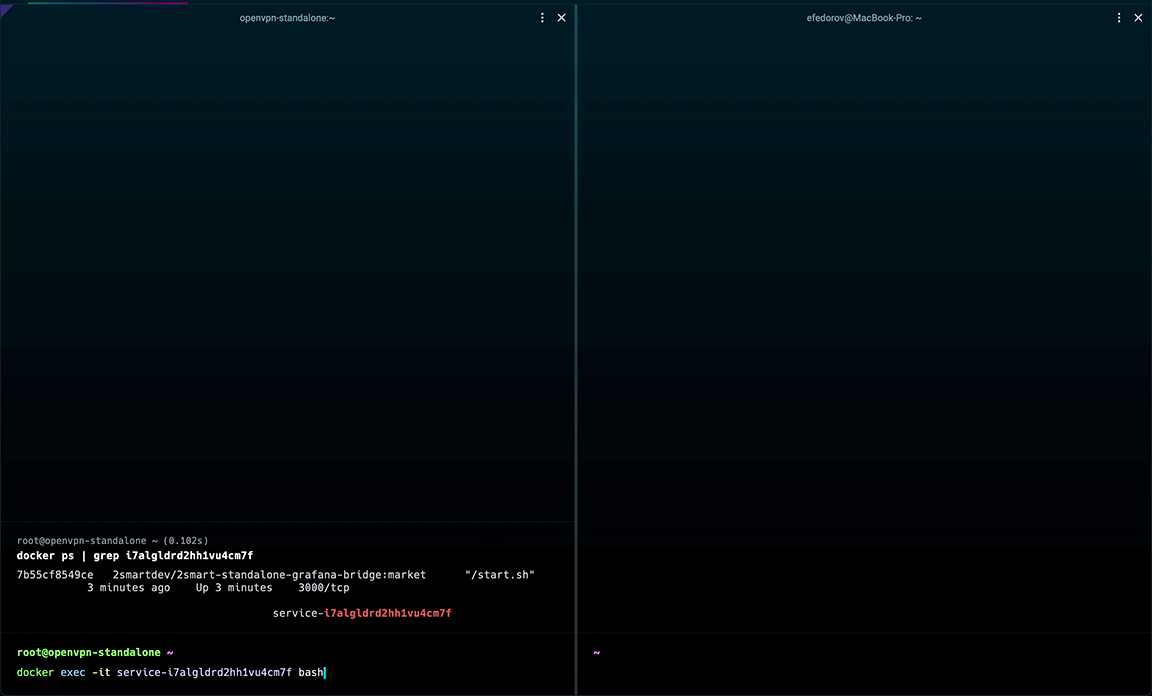
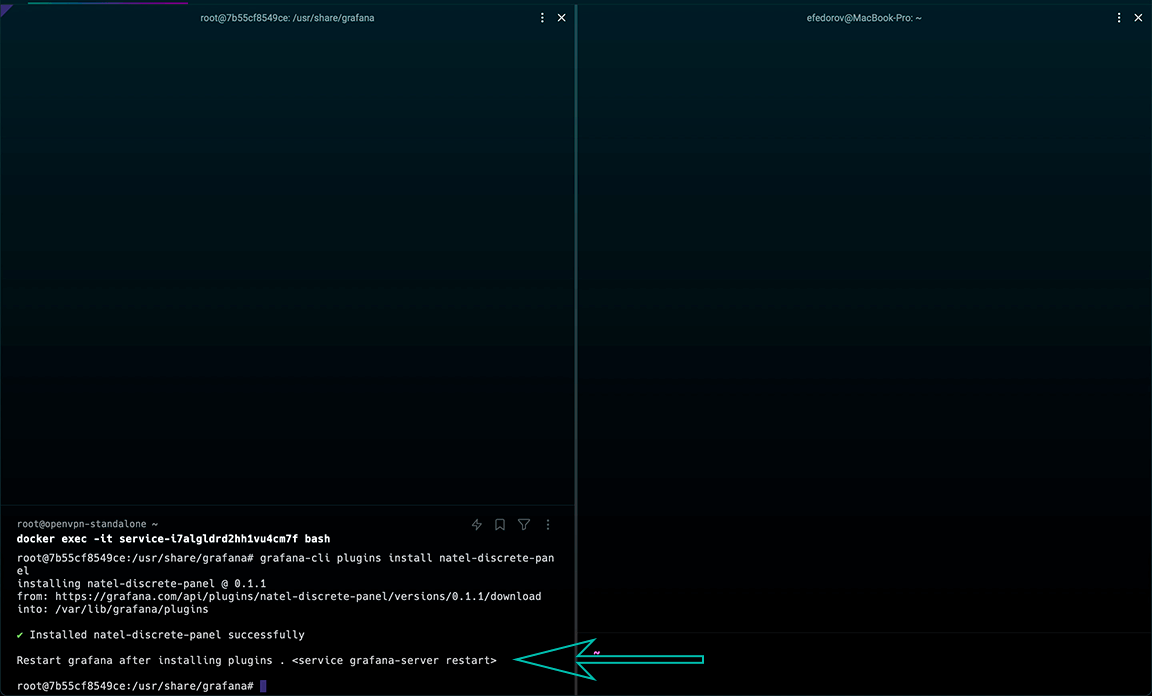
- Enter the container using the following command:
docker exec -it <container-name> bash
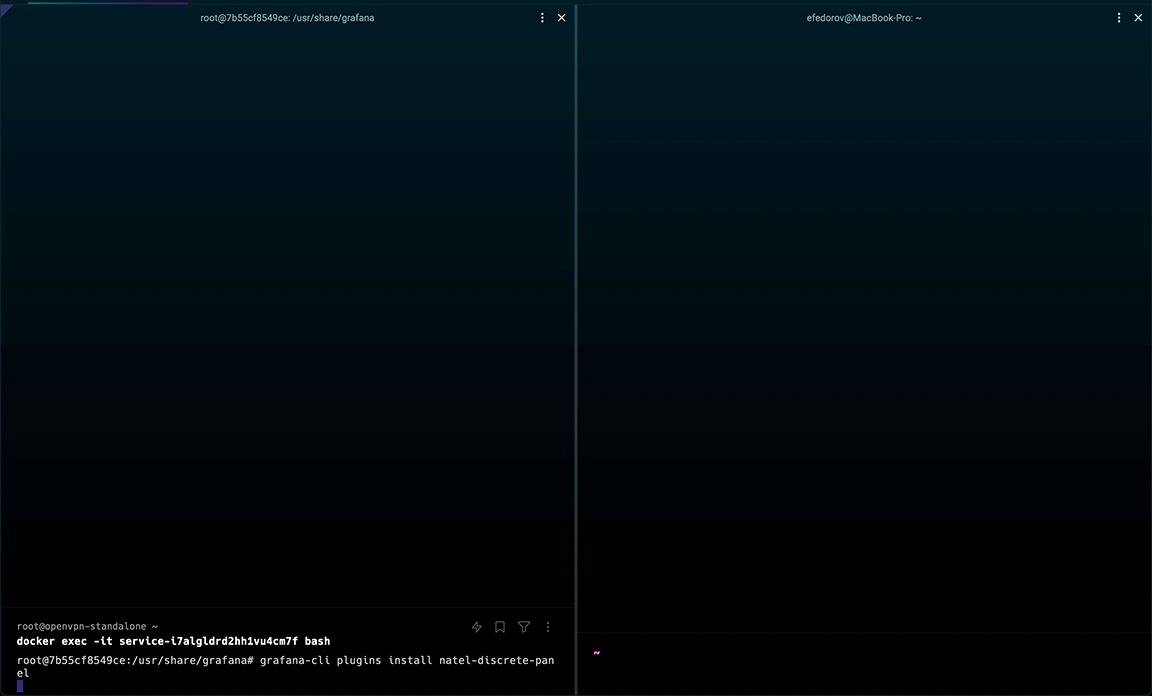
- To install the new plugin, enter the following command:
grafana-cli plugins install <plugin-name>
- Once the plugin is installed, you’ll see a notification to restart Grafana.
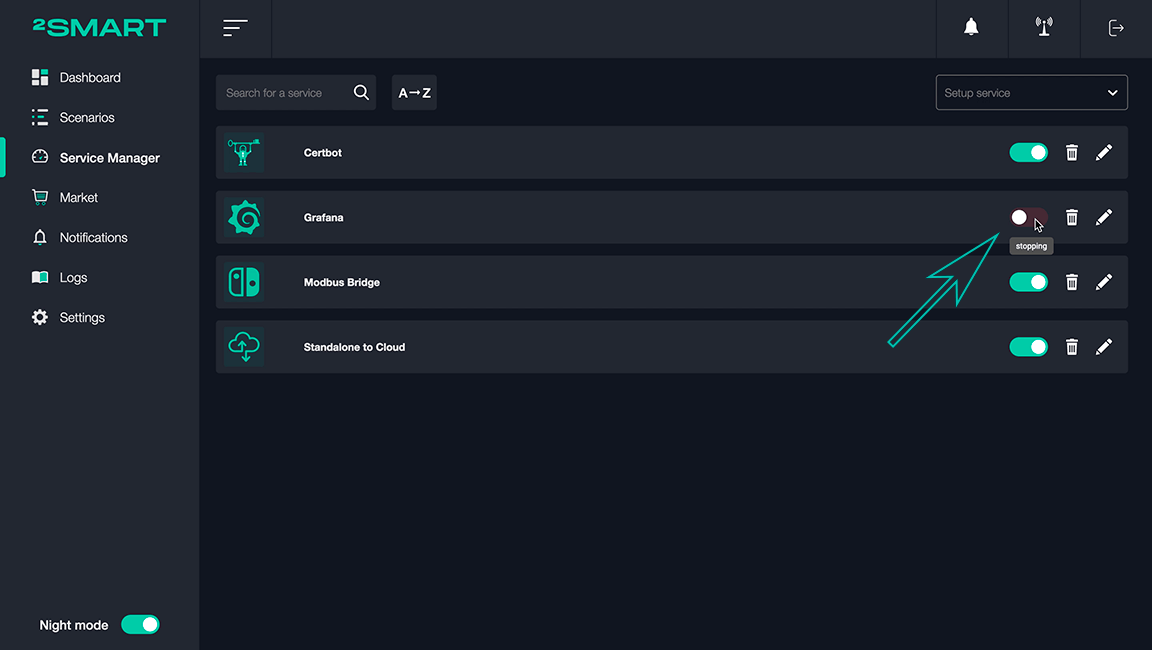
To do this, perform the following actions:- In the 2Smart Standalone admin panel, open the Service Manager section and find the Grafana row.
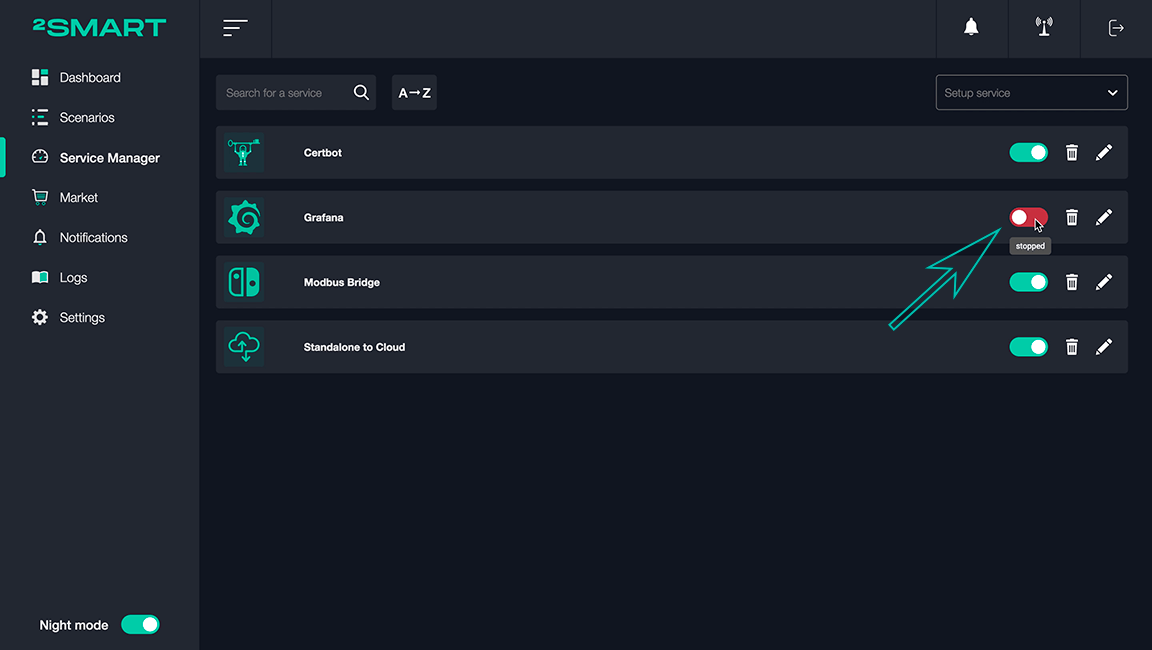
- Click on the toggle on the right to disable the service and wait for it to be completely disabled.
- Start the service again.
- In the 2Smart Standalone admin panel, open the Service Manager section and find the Grafana row.
- Go to Grafana and make sure the plugin appears in the list of available ones.
After the plugin has been added, you can add a new widget to your dashboard according to the Grafana documentation. In our case, here’s the widget we ended up with, which demonstrates the history of Relay 1 states.
Similarly, you can add any plugins available for Grafana if they are not already in your instance.
Conclusions
The collection and storage of historical data in the 2Smart Standalone monitoring and automation platform offer significant advantages for optimizing IoT system operations. Using the example of the Modbus bus deployed with the Teltonika gateway, we have demonstrated how easy it is to configure and utilize the platform’s built-in capabilities for accumulating and analyzing sensor data, as well as creating dashboards with the necessary graphs and tables in Grafana.
One of the key features of the 2Smart Standalone platform is its readiness to collect and store data from the moment of deployment without additional configuration by the user. Thanks to its integration with InfluxDB, the platform ensures efficient storage of historical data, enabling further analysis.
Additional features such as creating custom automation scenarios and working with the InfluxDB API open up broad prospects for more complex and flexible applications, such as anomaly detection and adaptation to changing environmental conditions.
FAQ
What types of sensors and devices can be integrated with the 2Smart Standalone platform?
The 2Smart Standalone platform supports integration with various types of sensors, including temperature, humidity, motion, light sensors, and many others, connected not only via the Modbus protocol but also through any other common standards.
The architecture of this automation platform does not limit users in terms of the standards used or the brands of IoT equipment manufacturers. In the platform’s Market, you can find ready-made bridges for integrating sensors and devices operating on different protocols. You can also develop your own bridges or seek assistance from the 2Smart team in their development.
How often are historical data updated in the 2Smart Standalone platform?
Historical data in the 2Smart Standalone platform are updated in real-time and stored in the InfluxDB database. The update frequency depends on the settings of the sensors and devices, but typically data is recorded every minute or more frequently.
Can I use the 2Smart Standalone platform to monitor and control multiple entities simultaneously?
Yes, the 2Smart Standalone platform offers the capability to monitor and control multiple entities simultaneously through a unified centralized control panel. You can create different groups of devices and configure individual scenarios and dashboards for them.
What additional features does the InfluxDB API offer for working with historical data in the 2Smart Standalone platform?
The InfluxDB API provides access to historical data from sensors and devices stored in the InfluxDB database. You can use the API to create custom reports, integrate with external analytics systems, or develop custom automation scenarios.
Don't forget to share this post!
Read Next


Let’s dive into your case
Share with us your business idea and expectations about the software or additional services.
