
Table of contents:
Highlights at a glance
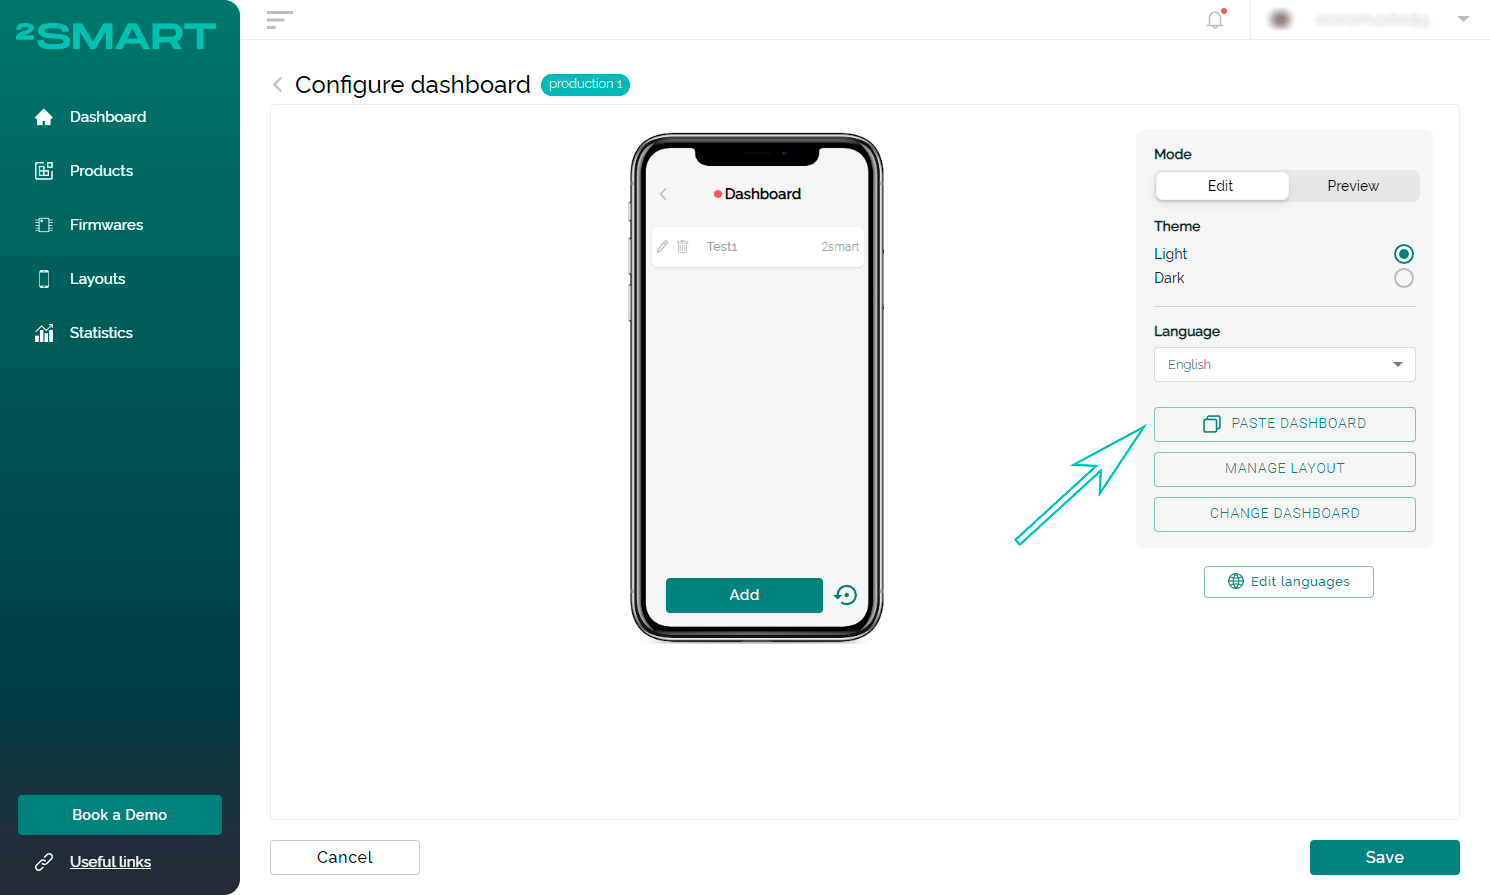
Simple Copying of Dashboards from Existing Mobile App Layouts to New Ones
The developer panel instance for business clients differs from the public version at cloud.2smart.com in several features. One of them is the ability to configure dashboards for the mobile application, which replaces the screen of favorite widgets from the native 2Smart Cloud app. The end user gets on this dashboard the ability to control the most essential device functionality and monitor the most important data without switching to the device screen.
The latest update makes working with these dashboards even easier. Now, developers can copy any existing dashboard into the layout of a new product and then make edits to it if necessary. This is especially useful in cases where different devices have similar functionality and require similar dashboards. Developers no longer need to spend time on repetitive work, they can simply use the Manage dashboard button in the mobile application layout editing window.
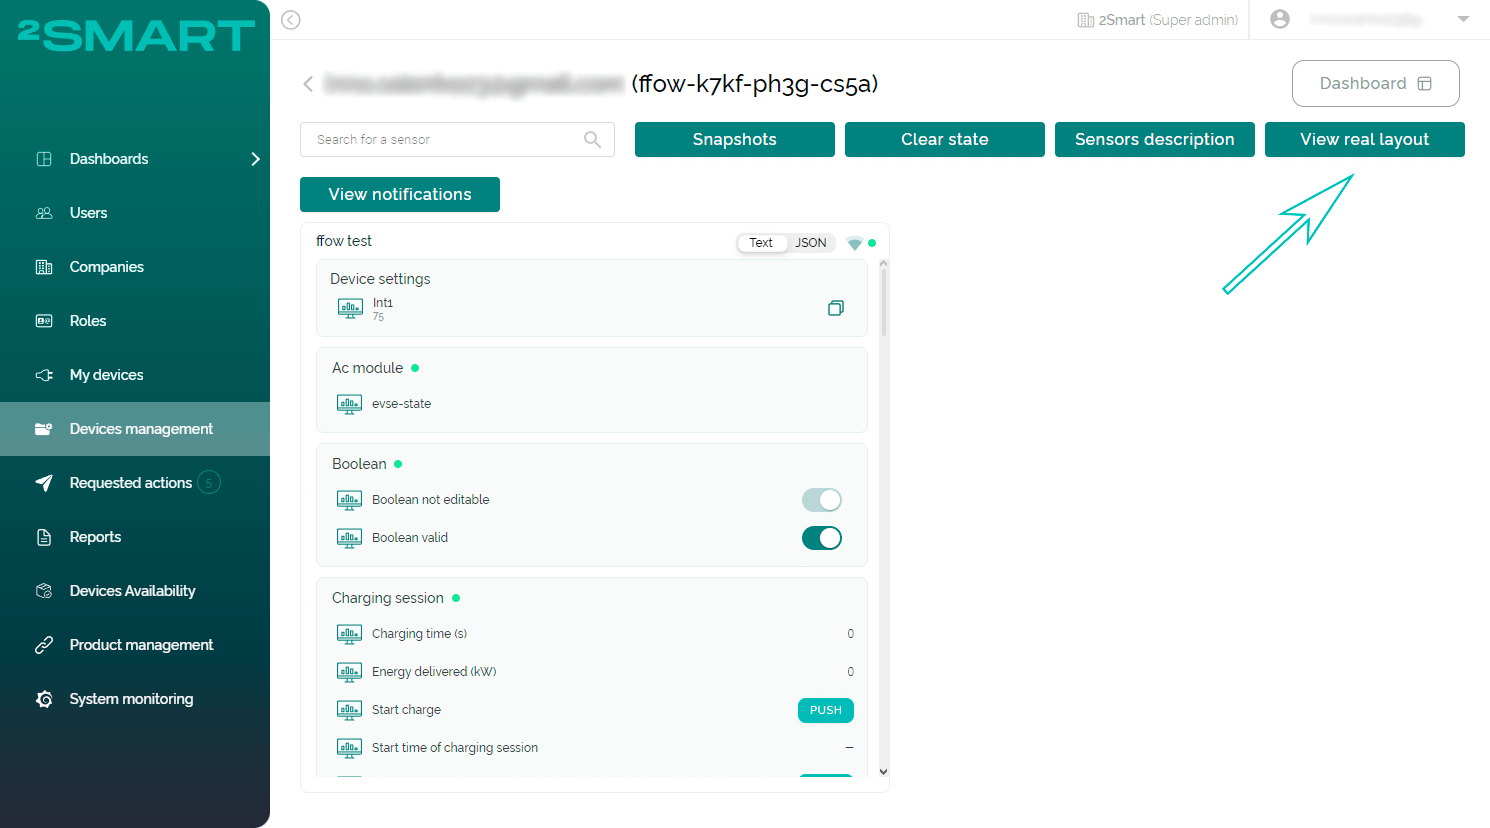
Viewing Real Layouts of the Mobile App
The device management and monitoring page on the Business Platform provides an interface where all sensors are available in a single list. However, the mobile app for managing the device presents sensors differently, using widgets and tabs, and it supports customized layouts for users with different roles. The end user’s layout can be vastly different from that of an administrator or technical specialist.
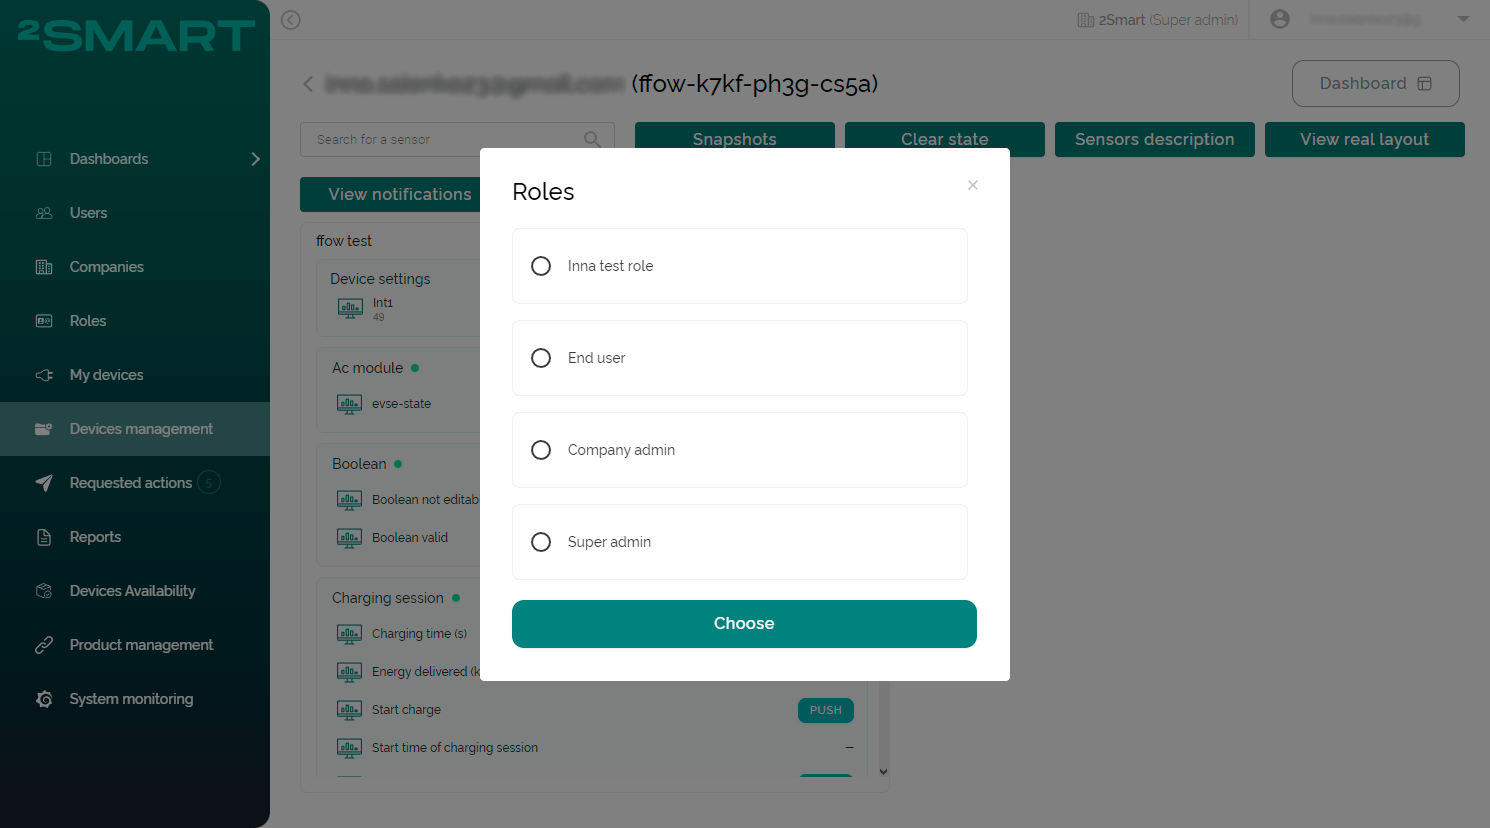
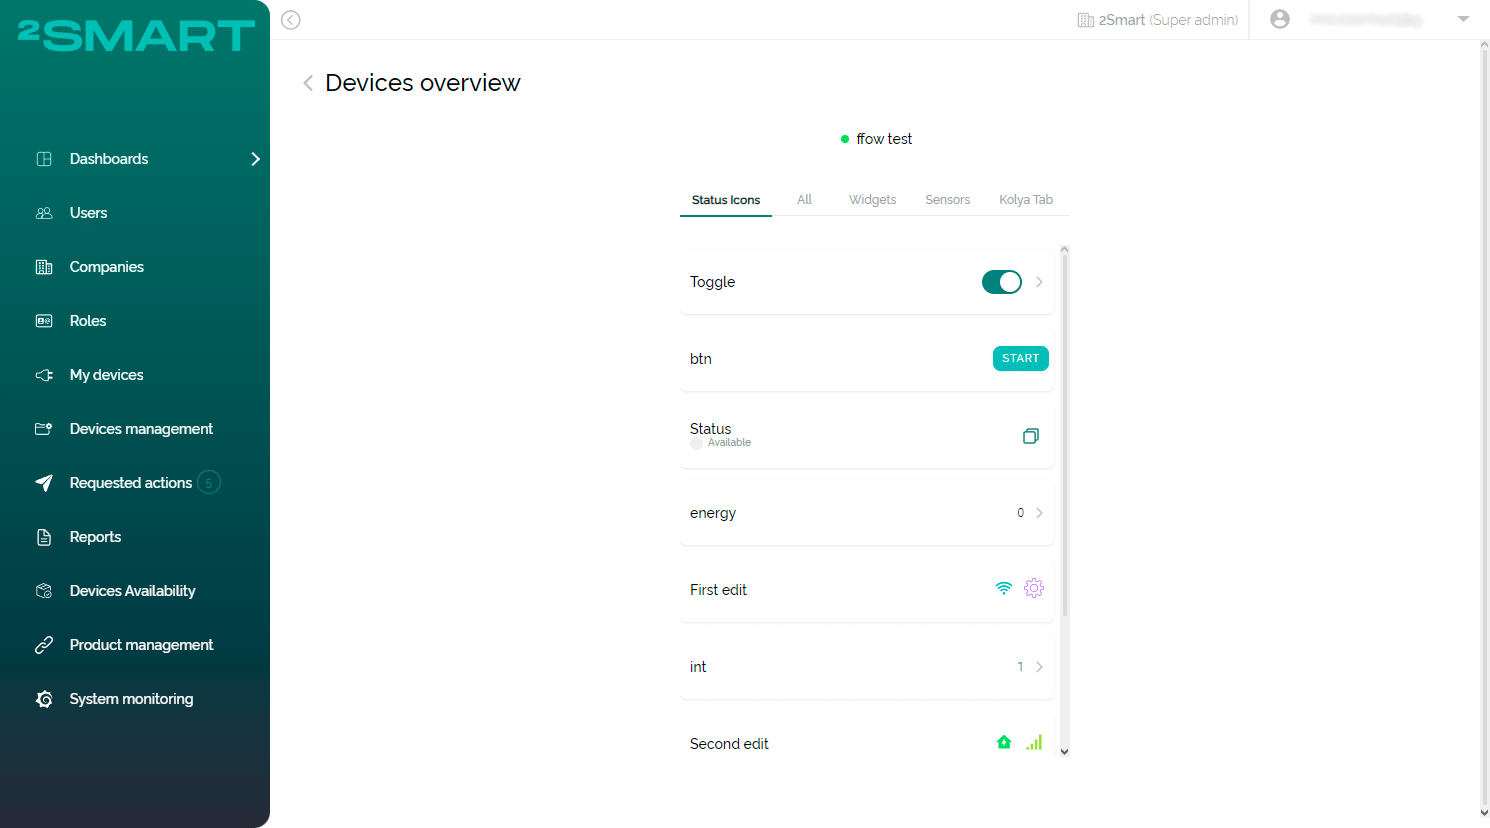
To give Business Platform administrators quick access to all the real layouts of the mobile app from the same window, we’ve added a “View real layouts” button. Clicking this button shows a list of roles with unique layouts. After selecting a role, you’ll see the corresponding layout and can manage the device directly from it.
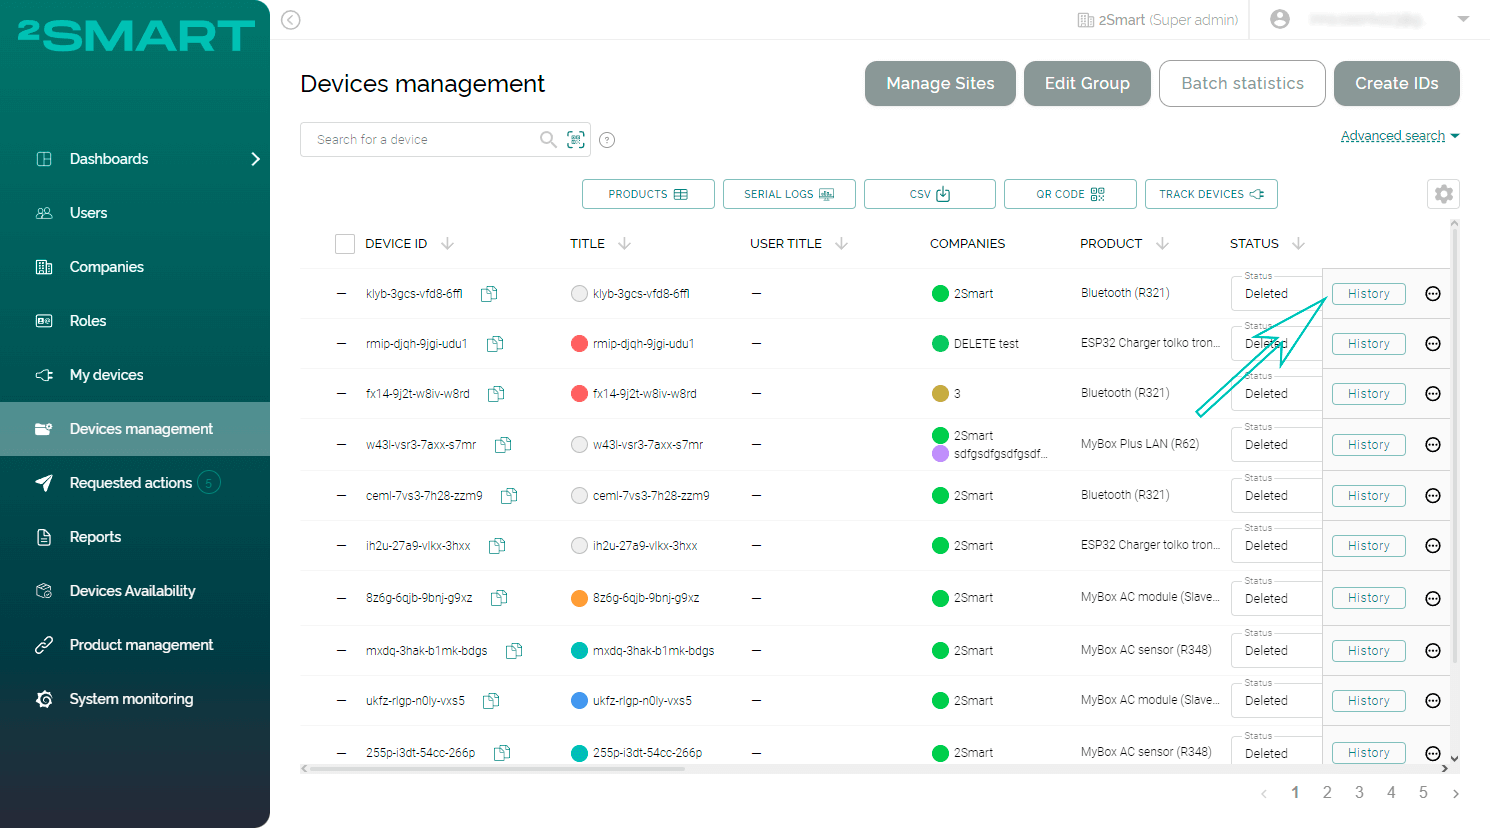
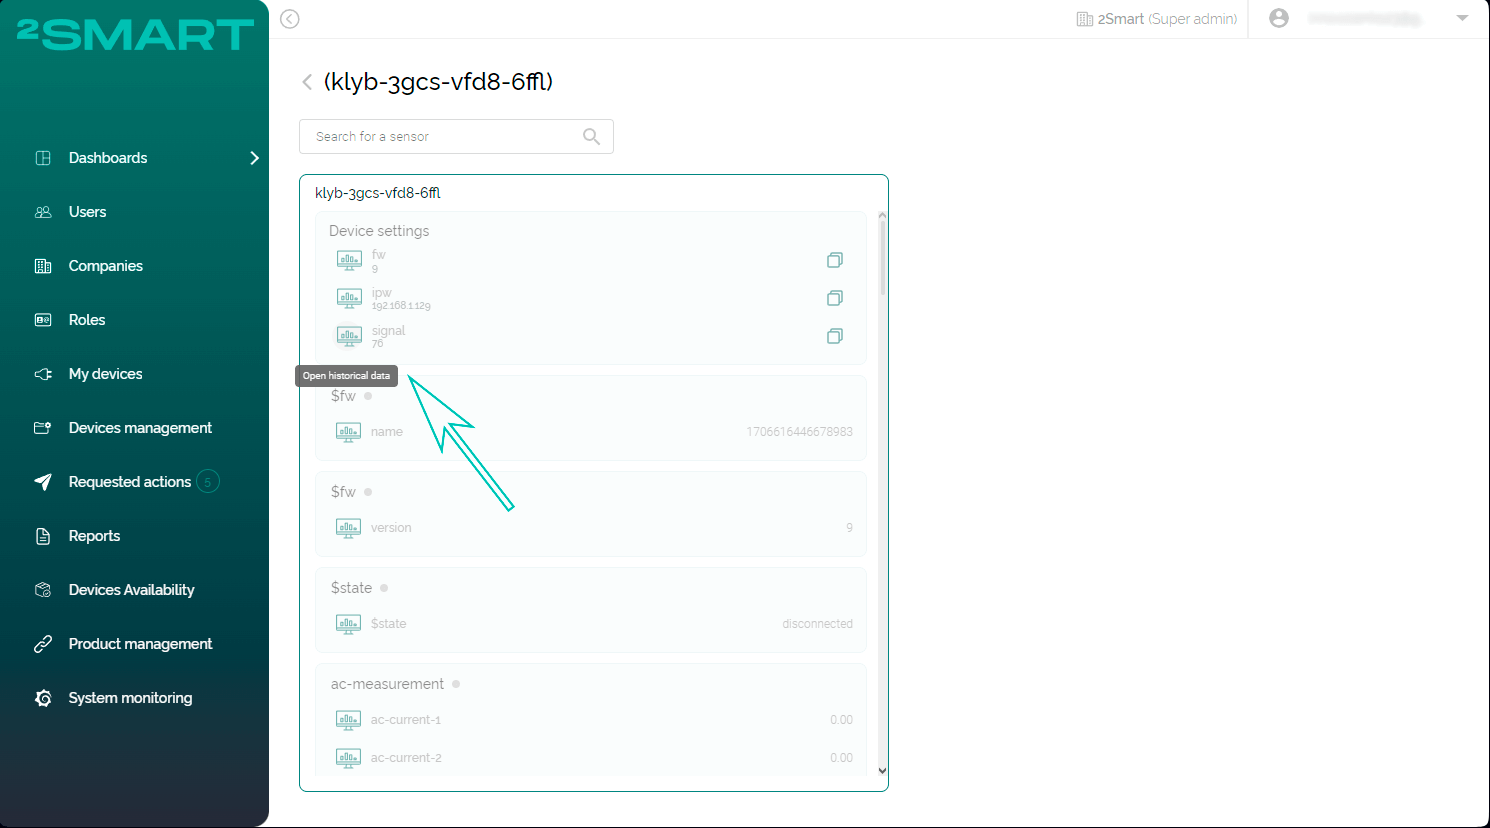
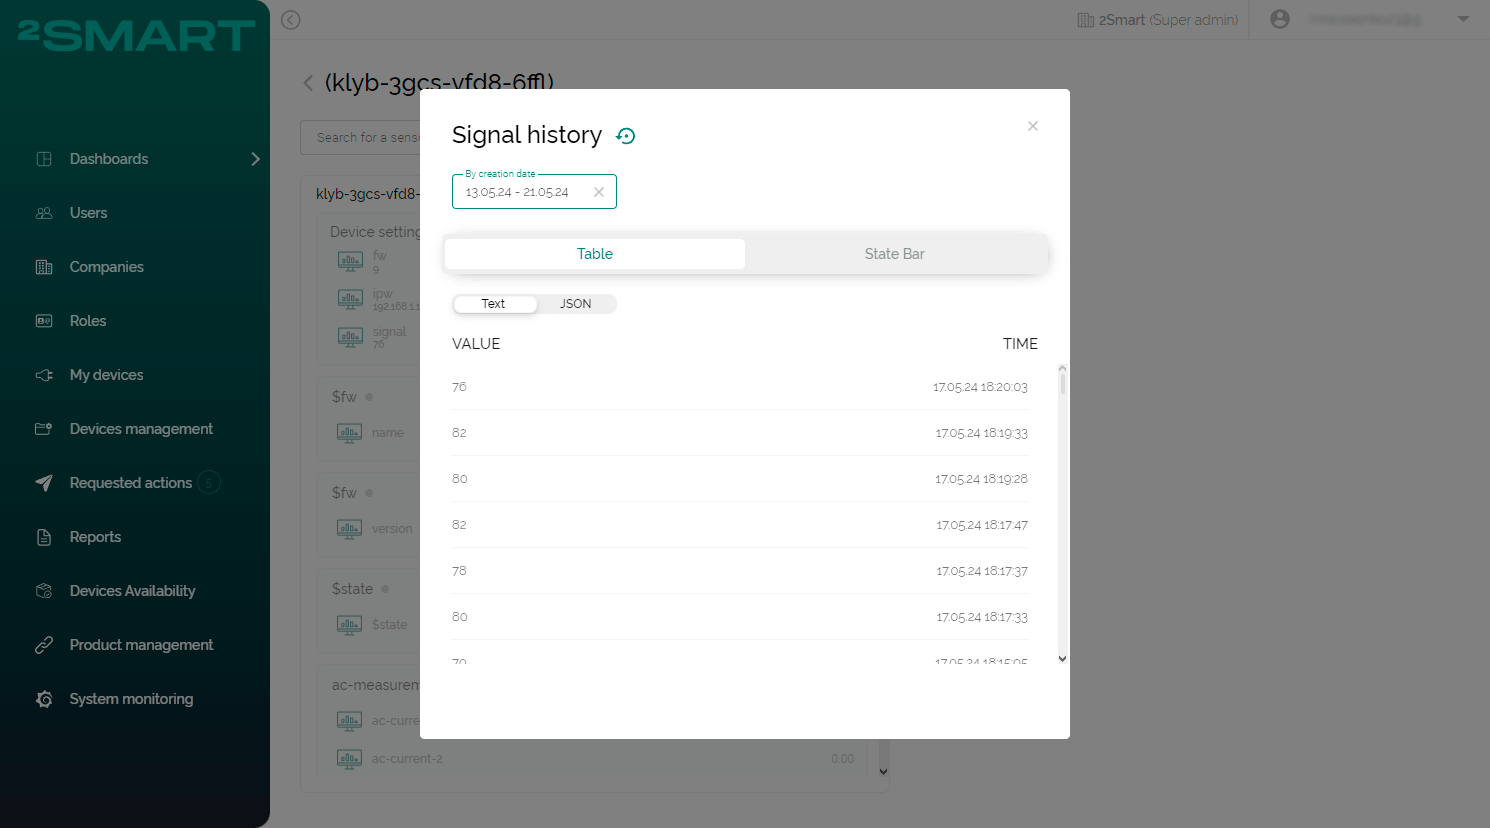
Viewing Historical Sensor Values of a Deleted Device
Administrators can now view historical sensor values of devices with any status, including “Deleted”. In the Device Management section, a “History” button has been added for deleted devices. Clicking this button takes you to the device monitoring page, where the “Open historical data” icon is located to the left of each sensor name.
Let’s collaborate
We’re empower your business with our technology expertise
Complete list of updates from January 31, 2024
Features:
- The ability to copy dashboards for the new major versions was added.
- The ability for administrators to view user layouts in device management was added.
- The ability to view the historical values of deleted device sensors was added.
- The ability to quickly prepare and apply the translations across the platform was added.
Fixed bugs:
- Speed up the “clear state” process.
- Reports aren’t downloaded from the Reports page on the admin panel after clicking the CSV button.
- The server error is shown on the Devices availability tab after sorting by owner.
- There is a timeout error on the platform after scanning the device ID.
- The “Relationship” column isn’t updated immediately on the admin panel after making any changes on the linked devices modal window.
Don't forget to share this post!
Read Next


Let’s dive into your case
Share with us your business idea and expectations about the software or additional services.
