
Table of contents:
Highlights at a glance
Descriptions of the device’s sensors in the vendor panel
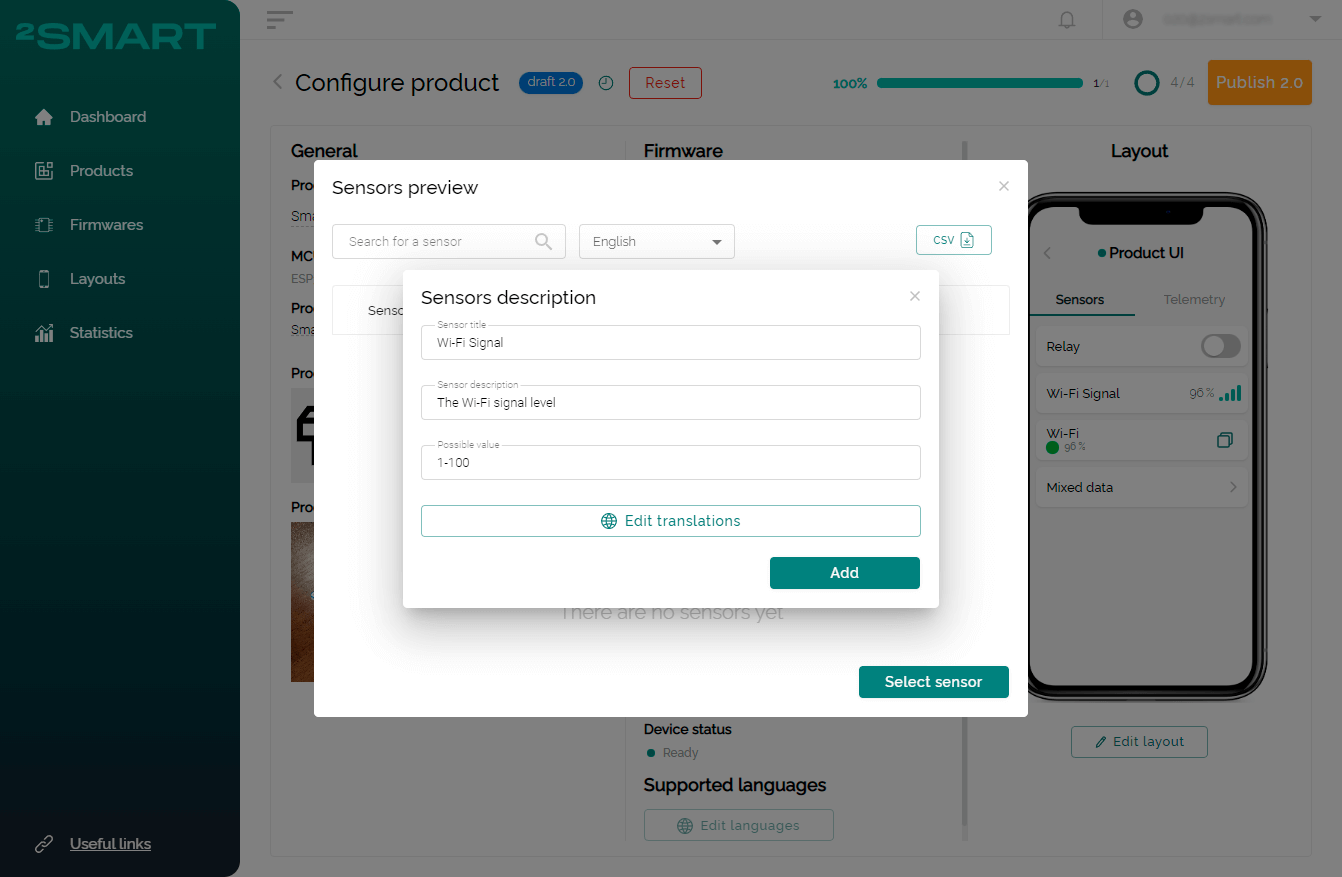
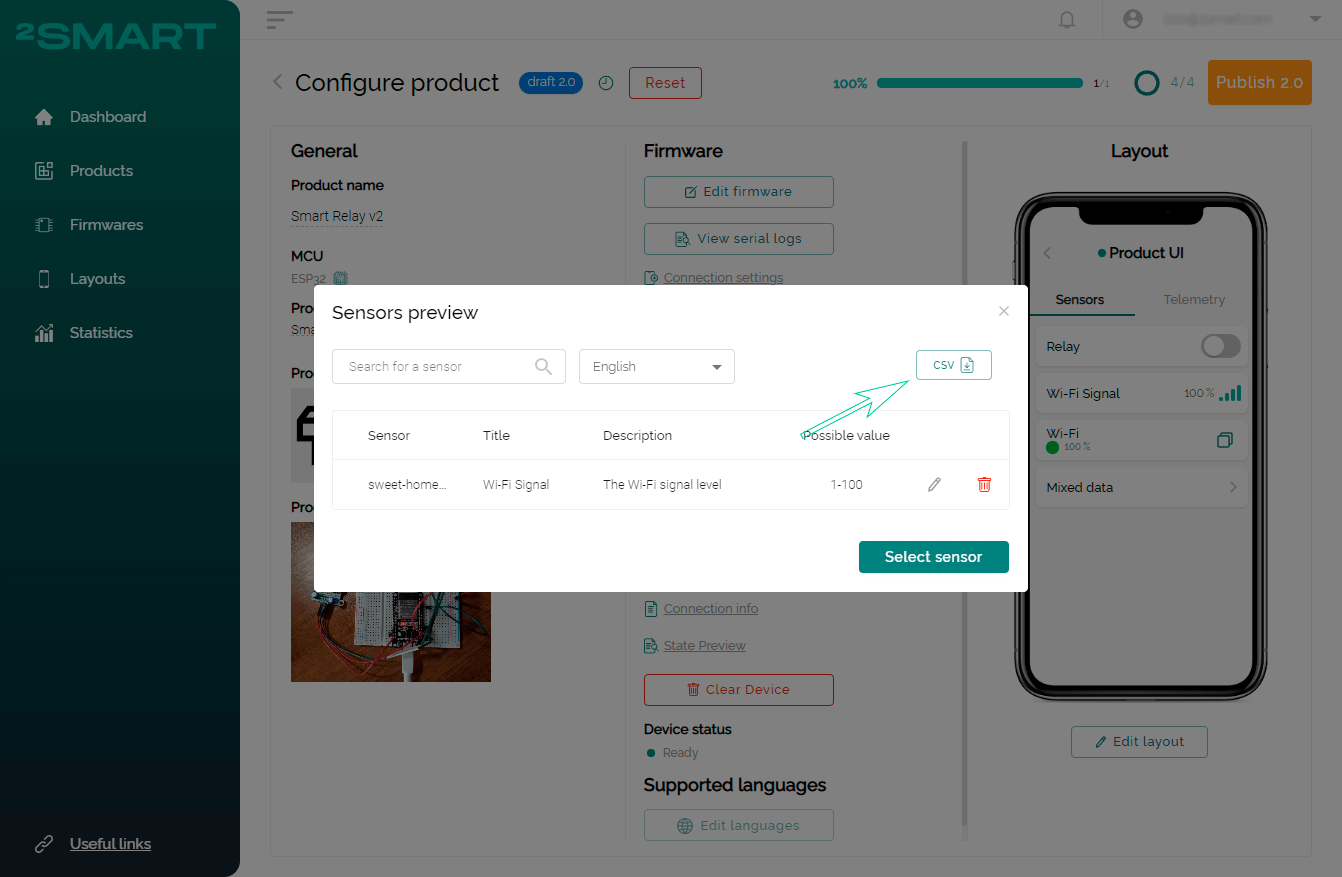
Now developers of 2Smart Cloud devices can add descriptions of sensors to their products and download these descriptions in the .CSV table format. You can specify each sensor’s title, description, and possible value.
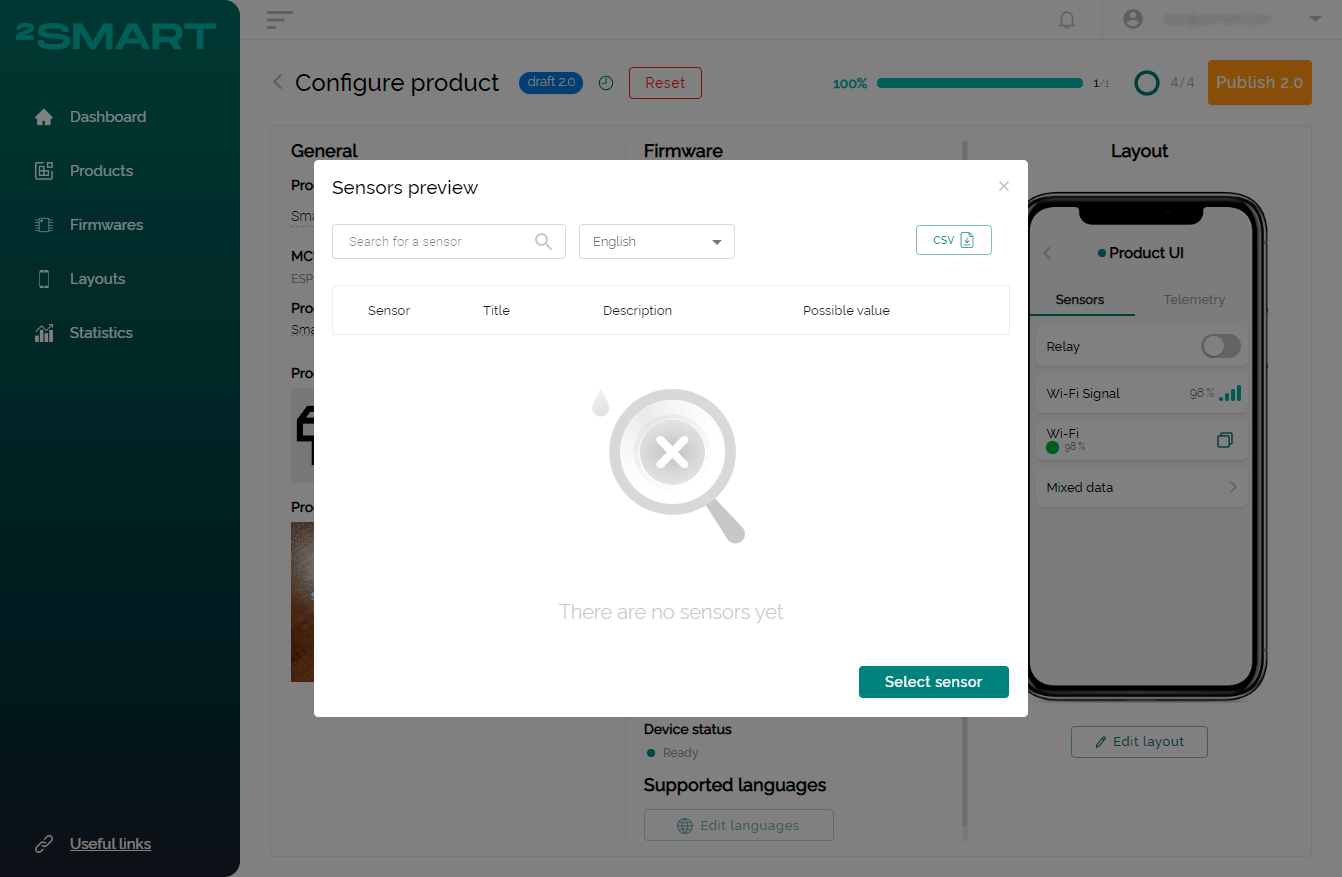
To use this functionality, click the “Add sensor description” link in your product’s configuration window.

Then click the “Select sensor” button and add descriptions for those sensors that require it.
You can use the “Edit translations” button to fill in the sensor descriptions in all available languages.
To download descriptions in .CSV format, click on the icon in the upper right corner of the modal window.

Ability to download test device sensor statuses
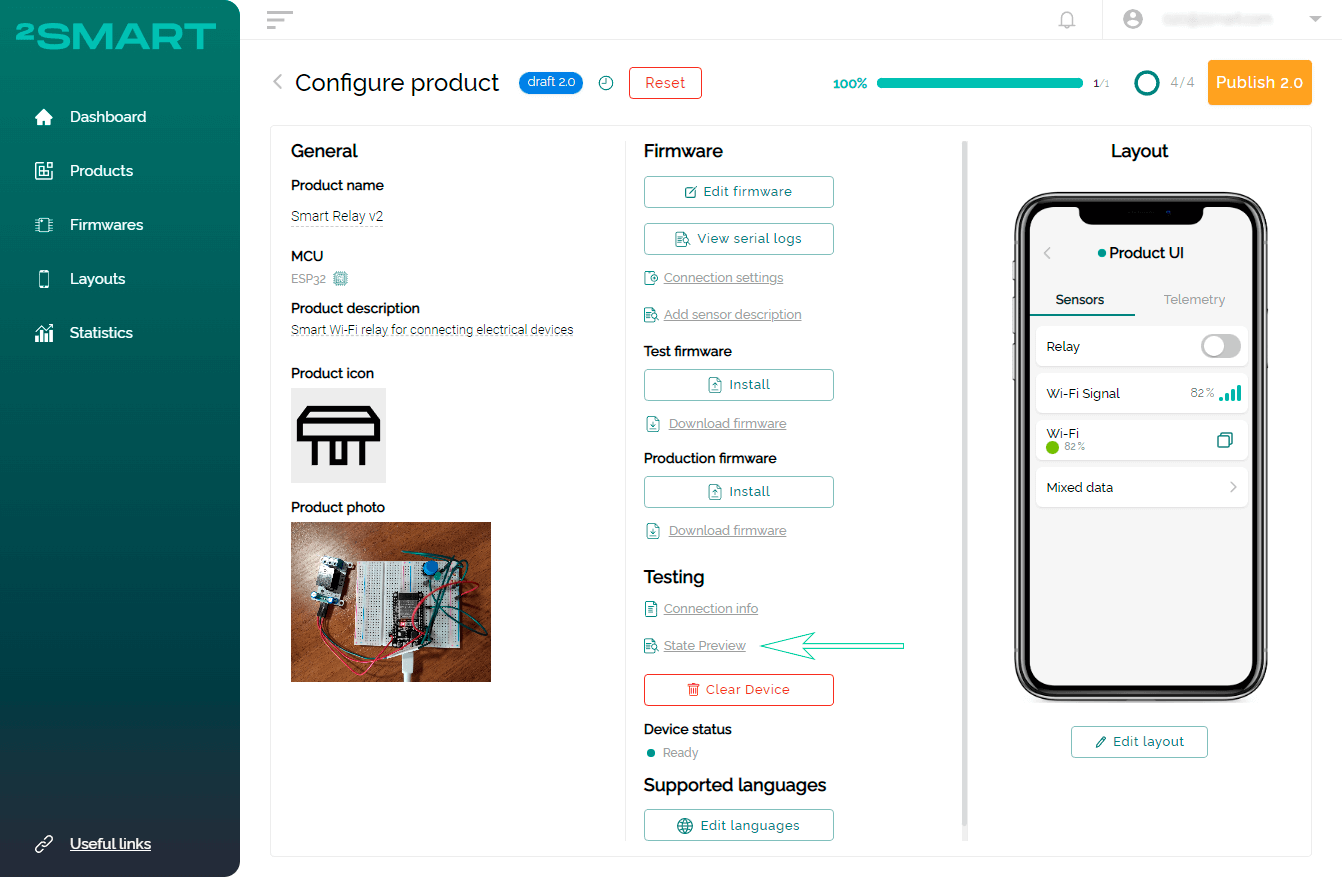
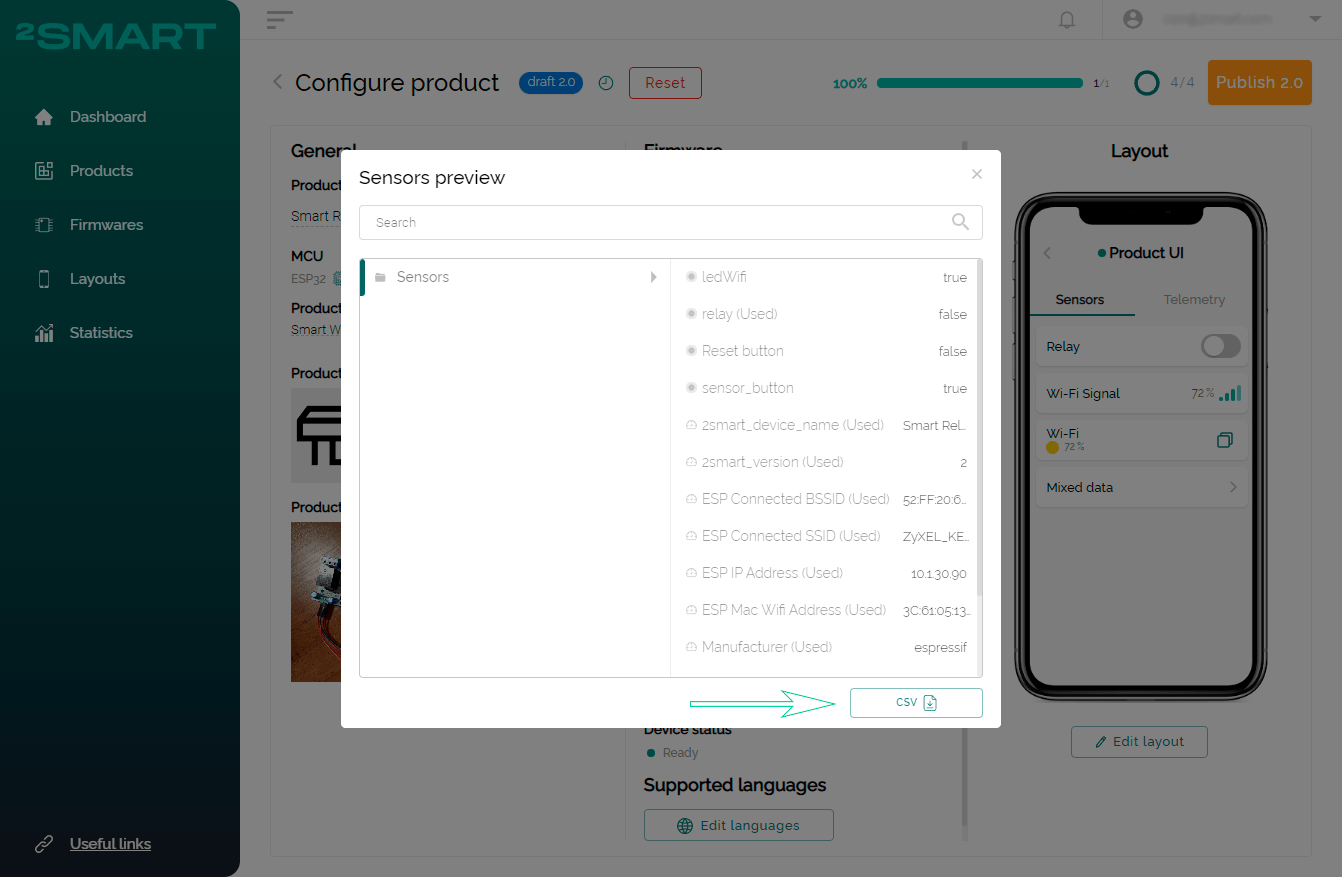
The “State Preview” modal window on the product configuration page displays the current sensor statuses of the test device connected to the platform. Now you can quickly save the current statuses of all sensors by downloading them as a table in .CSV format.
To do this, click on the “State Preview” link and then click on the CSV icon in the lower right corner of the modal window that appears.
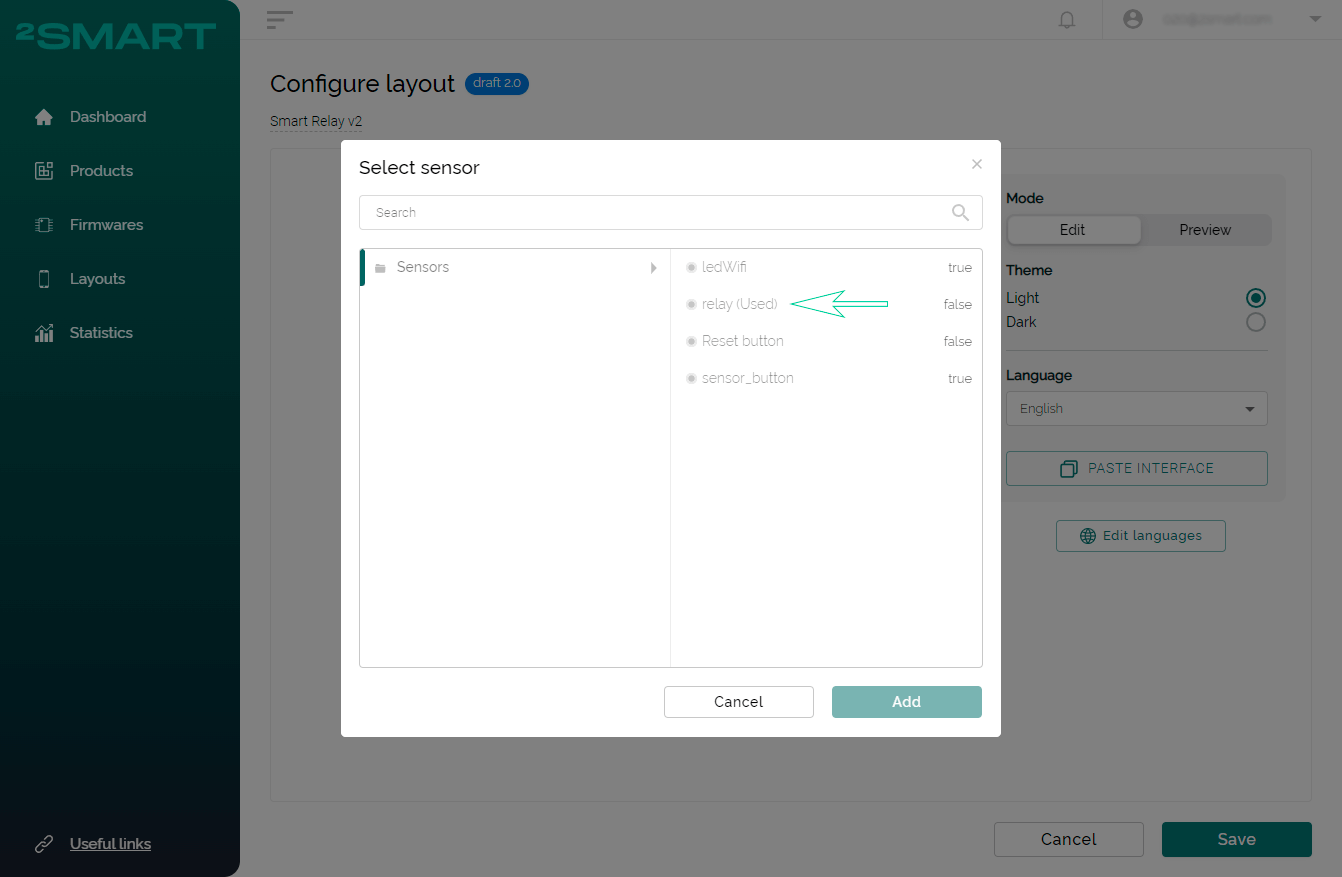
Viewing sensor usage status when configuring a mobile app layout
For the convenience of developers, we have added the sensor usage status to the interface for configuring the mobile application layout. Now the sensors for which the widget to control or view the state have already been configured are marked with the word “Used” in the list.
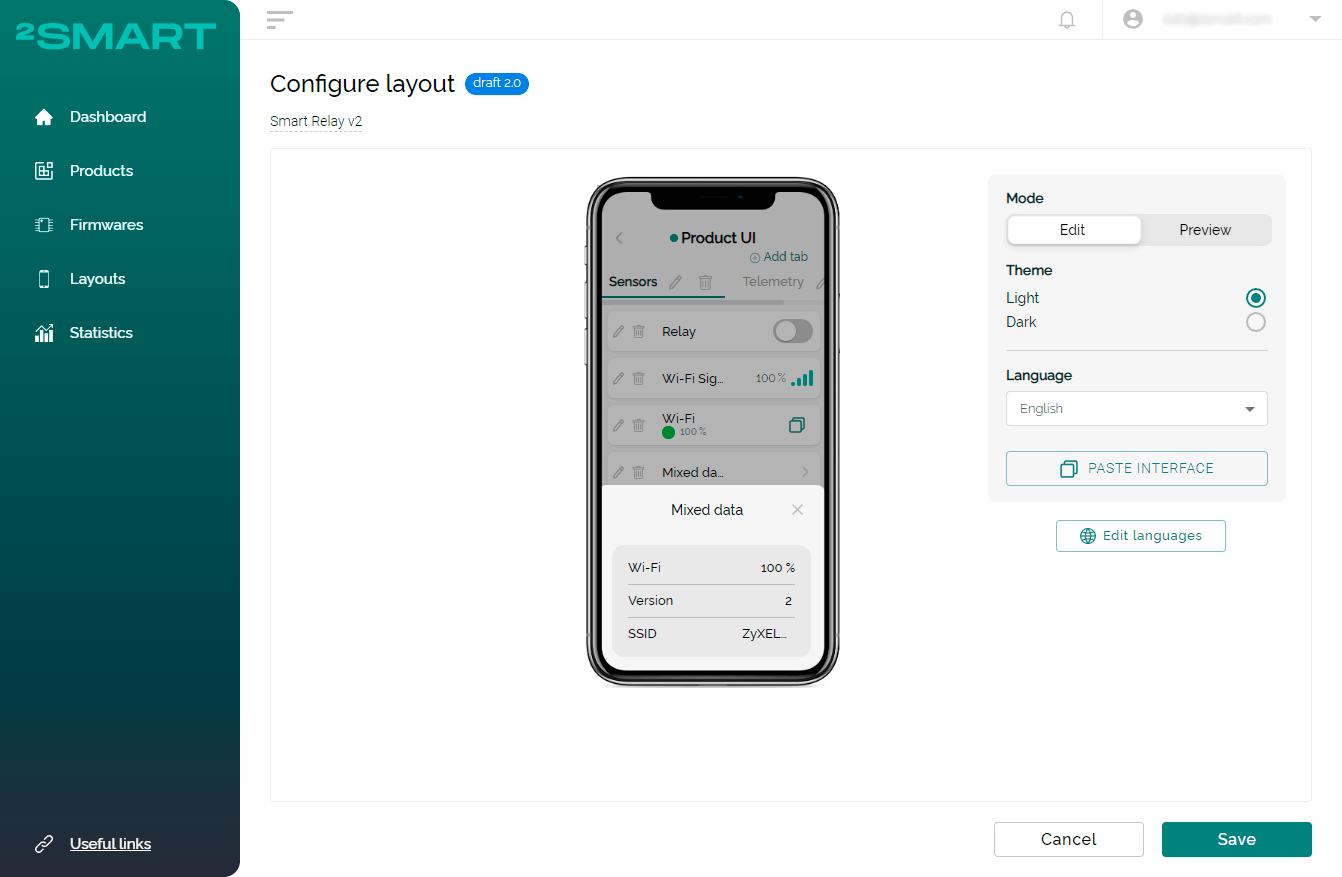
New mobile application widget “Mixed data”
The new widget allows you to configure the display of data from up to three sensors in a single modal window in the mobile application. You can use this widget to give app users quick access to the most critical telemetry of the device.
“Grid” widget improvements
We continue to improve the “Grid” widget, which is used as an aggregator for other widgets. You can now add widgets such as “Charging status”, “Color”, and the new “Mixed data” widget to the grid.
Let’s collaborate
We’re empower your business with our technology expertise
Complete list of updates from May 11, 2023
Features:
- Ability to fill the description of the sensor in the vendor panel.
- Support of the “Mixed data” widget.
- Ability to view the use status of the sensor in the layout.
Minor improvements
- Integration of Mixed data widget into Grid.
- Integration of Charging status widget into Grid.
- Ability to view components titles in the Grid widget settings.
- Integration of the color picker widget into the Grid widget.
Fixed bugs:
- The min max values validation is missed on the vendor panel during the creation “Charging status” widget.
- The “Status icons” widget is not clickable if the first non-editable topic is set for the product.
Don't forget to share this post!
Read Next


Let’s dive into your case
Share with us your business idea and expectations about the software or additional services.
