
Table of contents:
Tracking the sensor values of Internet of Things devices in real time and dynamically is useful. Through the Number widget in 2Smart Cloud, developers can provide this ability to consumers of their devices. It is sufficient to include it in the mobile application’s interface, and a historical graph of temperature, humidity, and any other parameter changes will be available in two clicks.
When is the history of smart device sensor values useful?
Monitoring the temperature and humidity in a greenhouse is a basic example of when a graph with a history of data is useful. Another example is a home weather station that monitors the amount of carbon dioxide and other pollutants in the atmosphere in addition to temperature and humidity.
More complex options are monitoring any parameters of home or industrial equipment operation. This can be the load on the house’s electricity grid, the temperature of the coolant, etc.
Users do not need to record sensor readings to track data over time; all they have to do is open the graph on the mobile app.
How to install the Number widget
The Number widget is available when the device developer configures the 2Smart Cloud mobile application interface. It can be installed for the required sensors at the product creation stage or at any time later as part of the interface update.
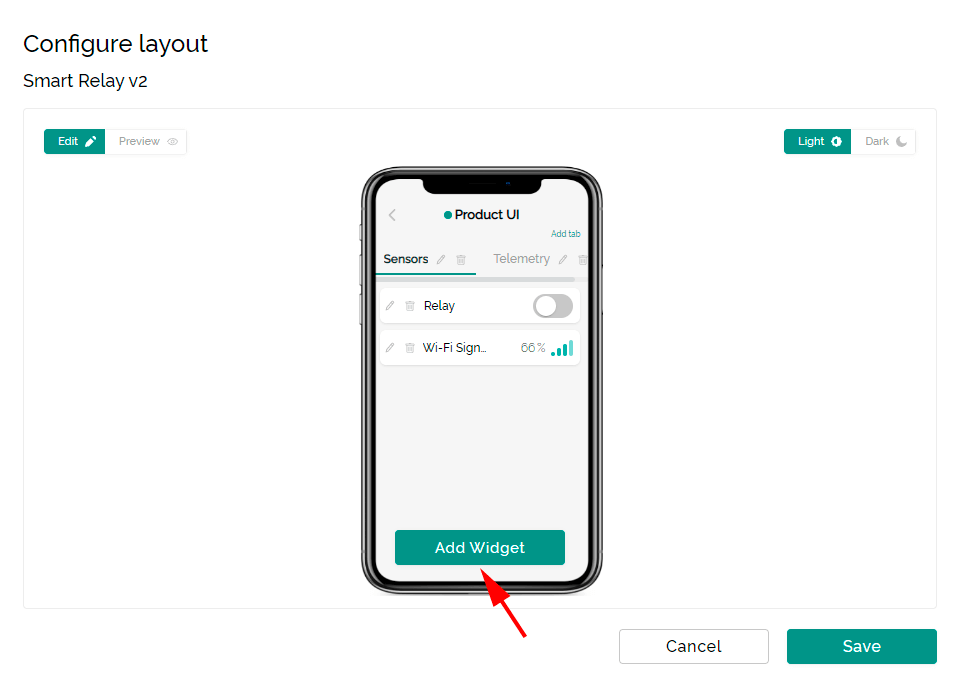
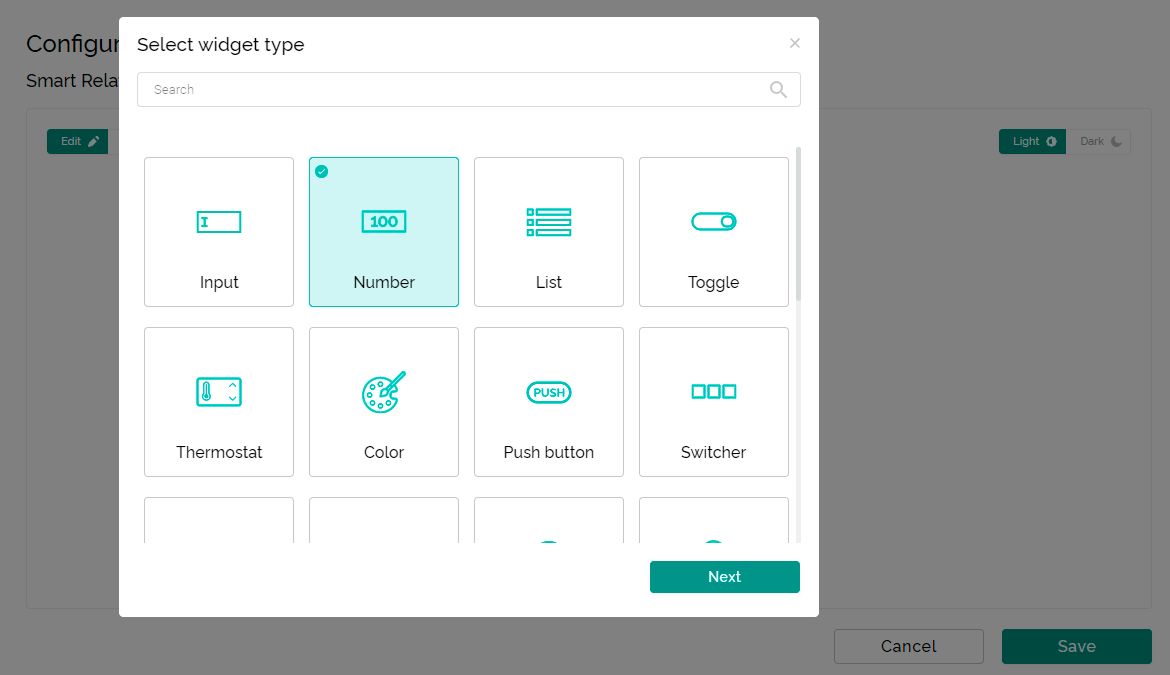
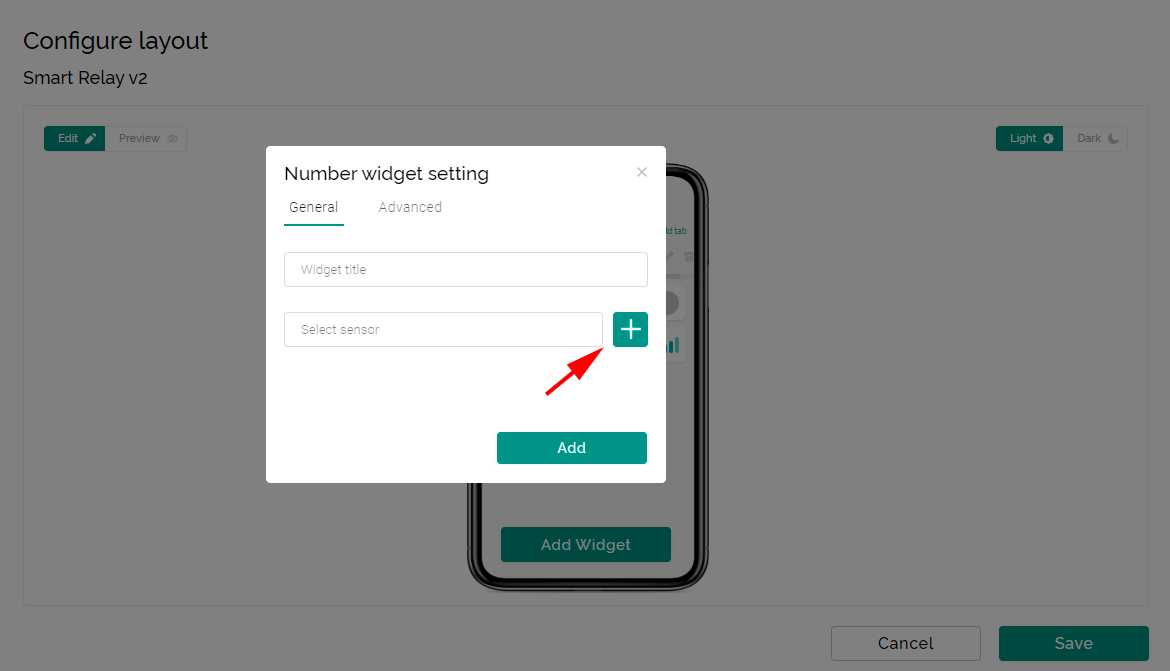
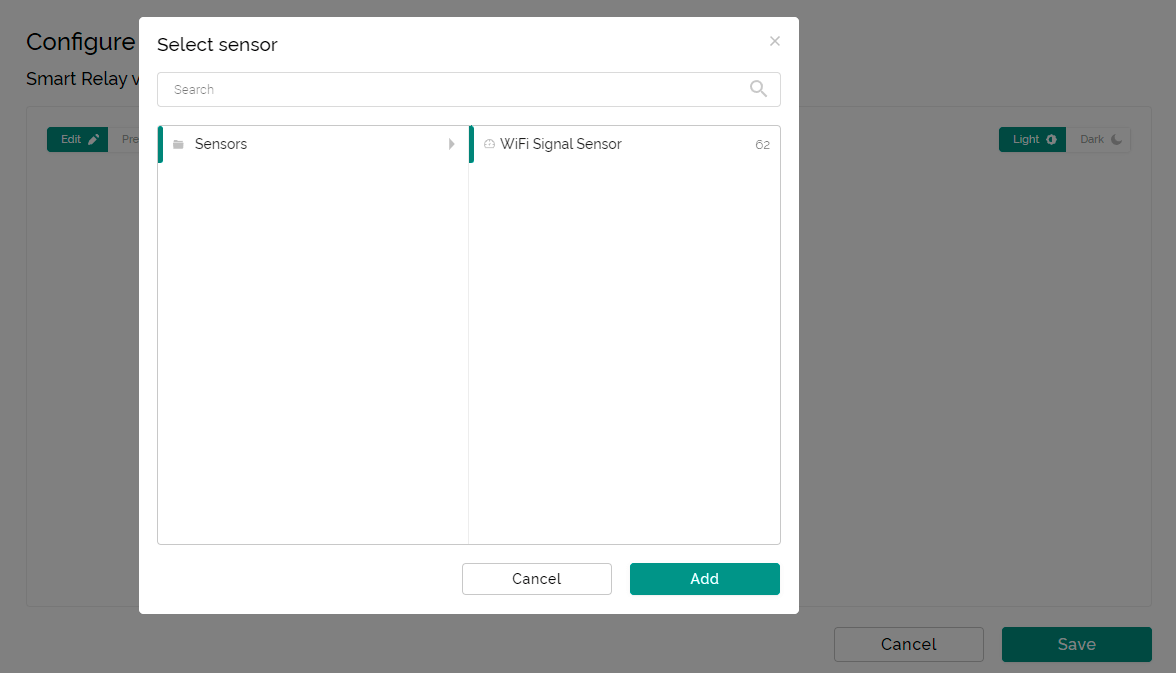
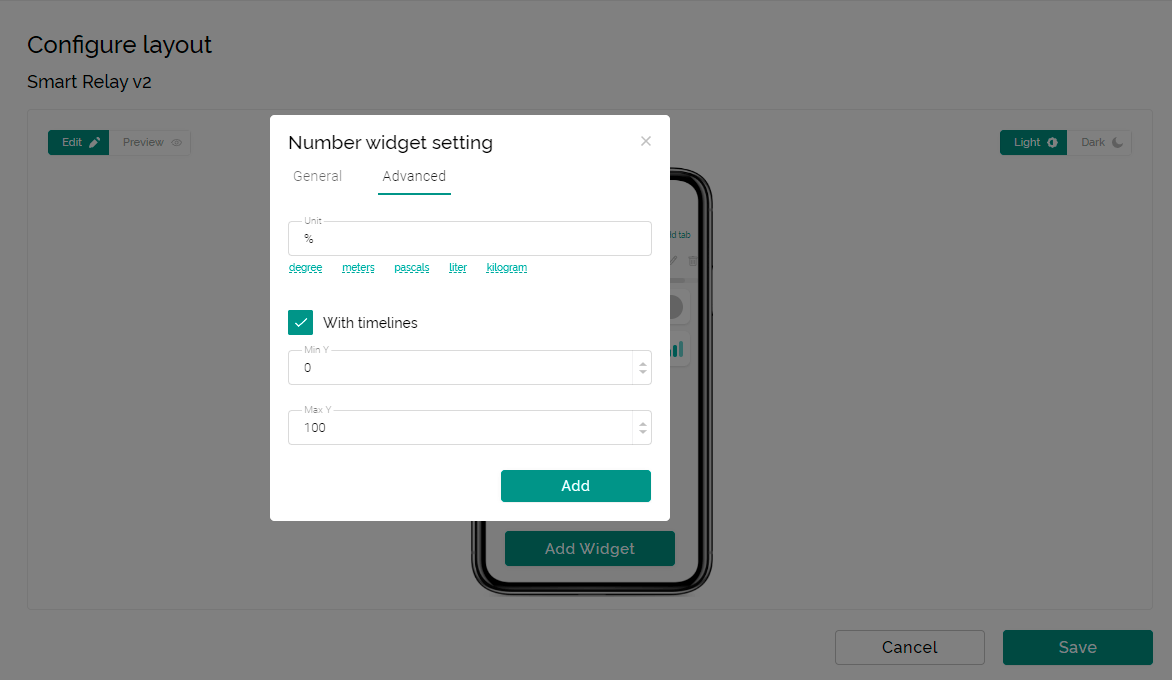
This widget supports any sensors that transmit numeric values. These can be temperature, Wi-Fi signal level, or device battery charge. To see the list of supported sensors for a particular device, click on the sensor selection button in the settings window.
For a graph of historical sensor values to be formed, set the “With graph” checkbox on the “Advanced” tab of the settings window. You can also configure the other parameters of the graph: the minimum and maximum values along the Y-axis (by default, this is from 0 to 100).
Let’s collaborate
We’re empower your business with our technology expertise
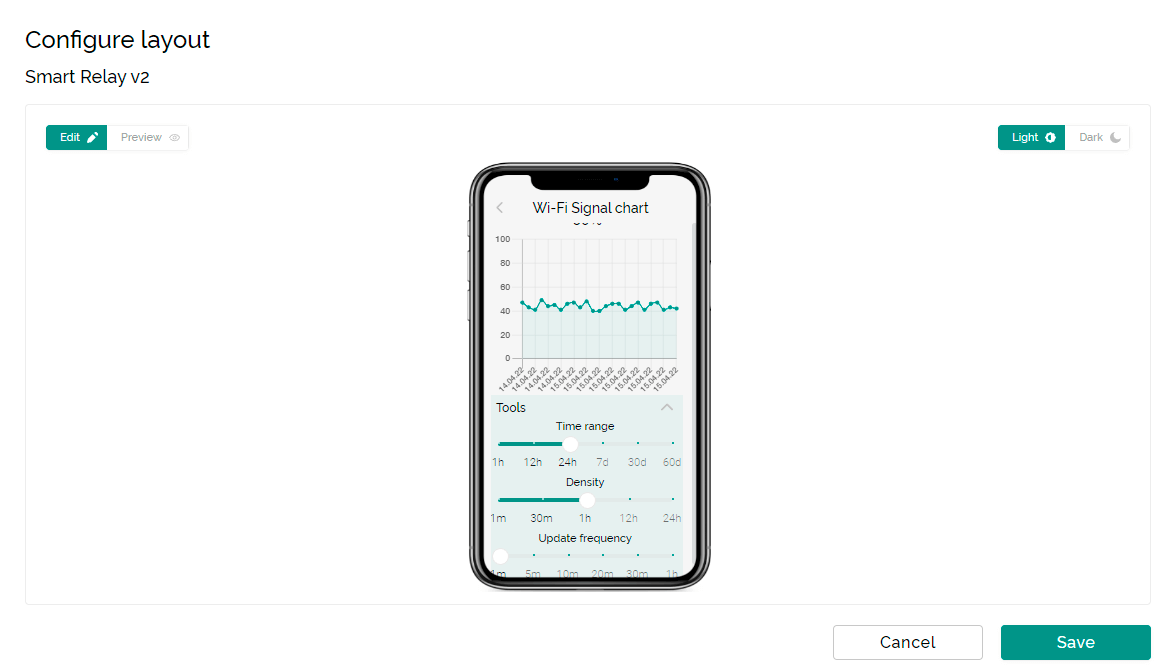
The graph’s appearance on the mobile application can be estimated in advance using the browser’s emulator. Please keep in mind that the chart in the emulator is for illustration purposes only; it does not contain actual sensor information. The accurate graph will be available in the user’s mobile application; its creation will take time.
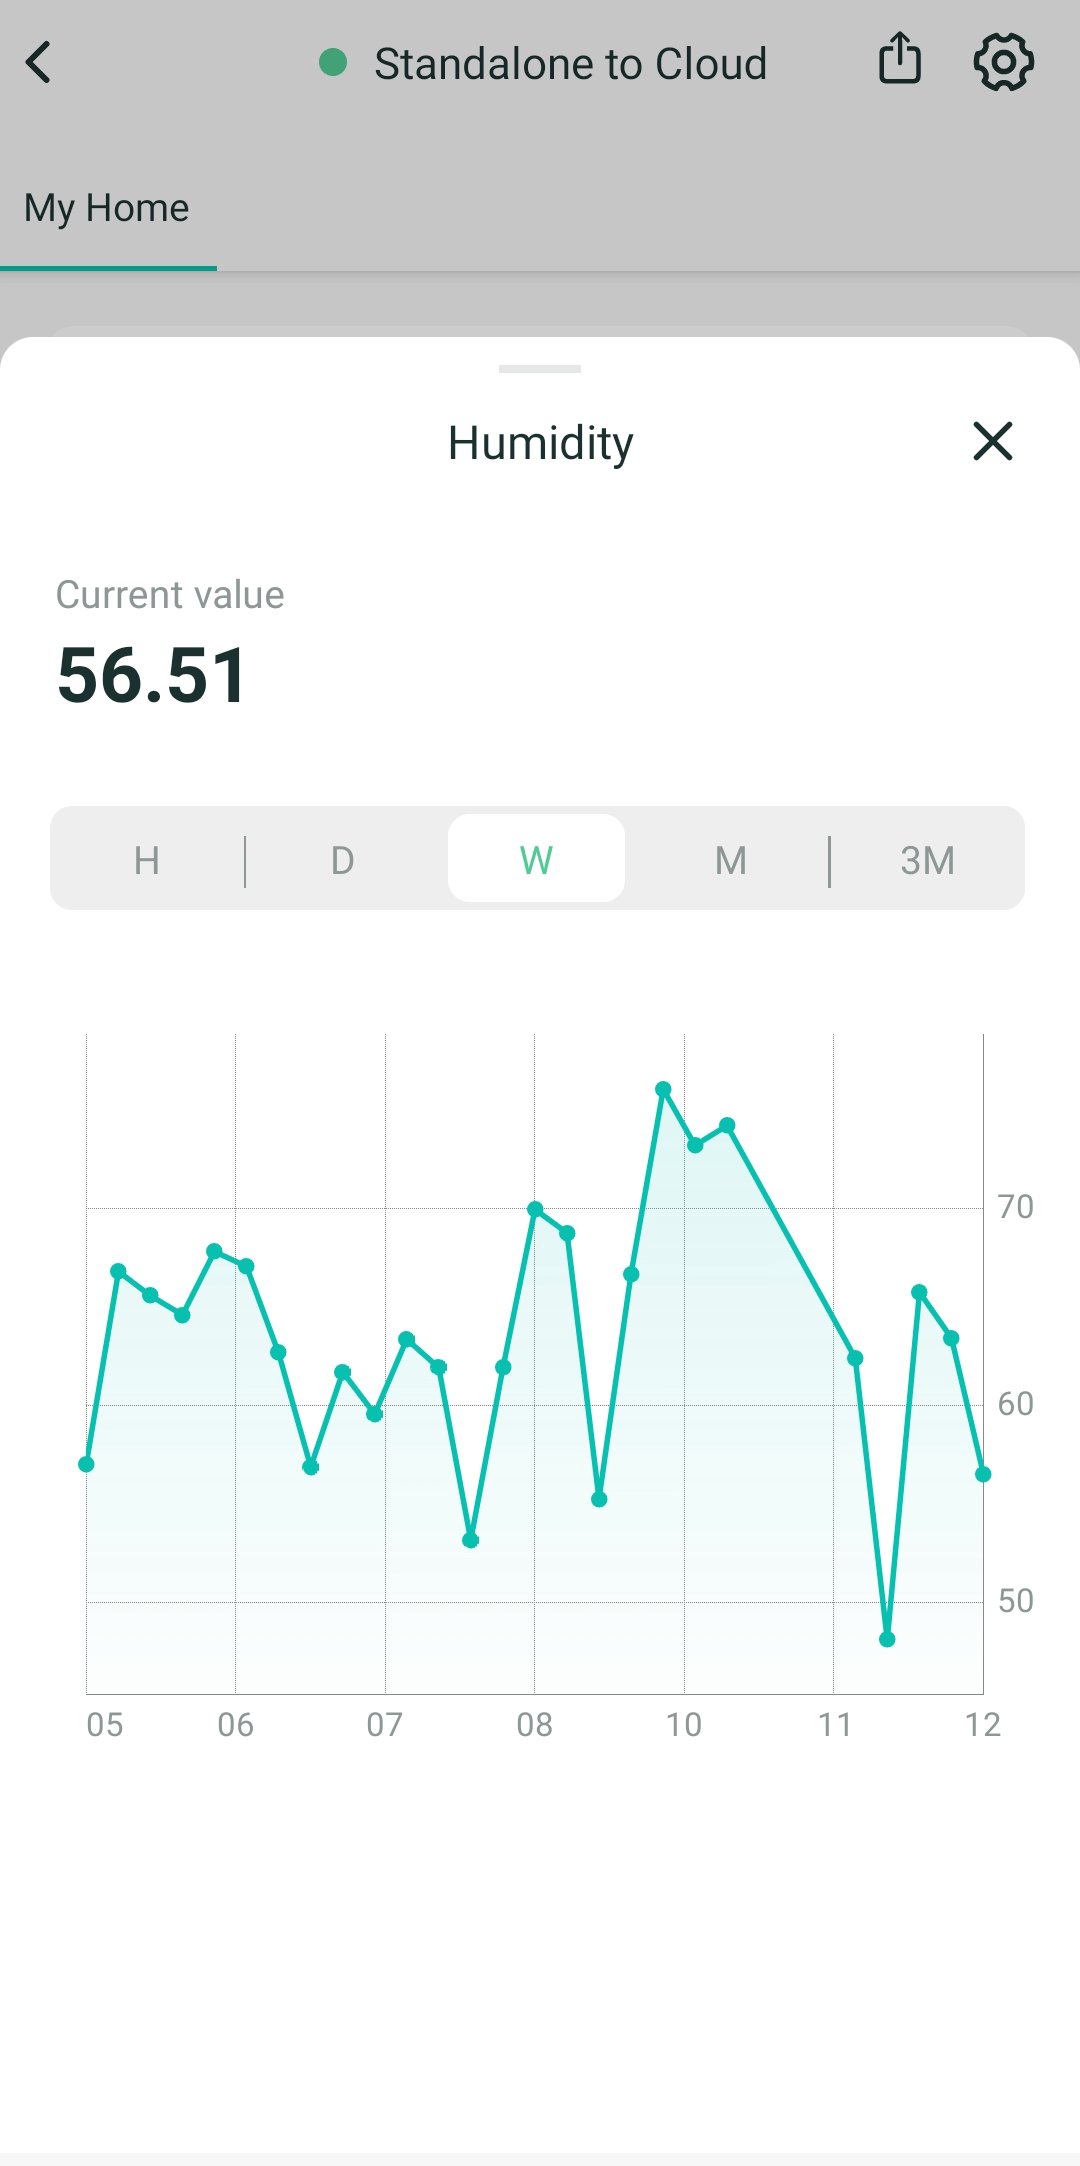
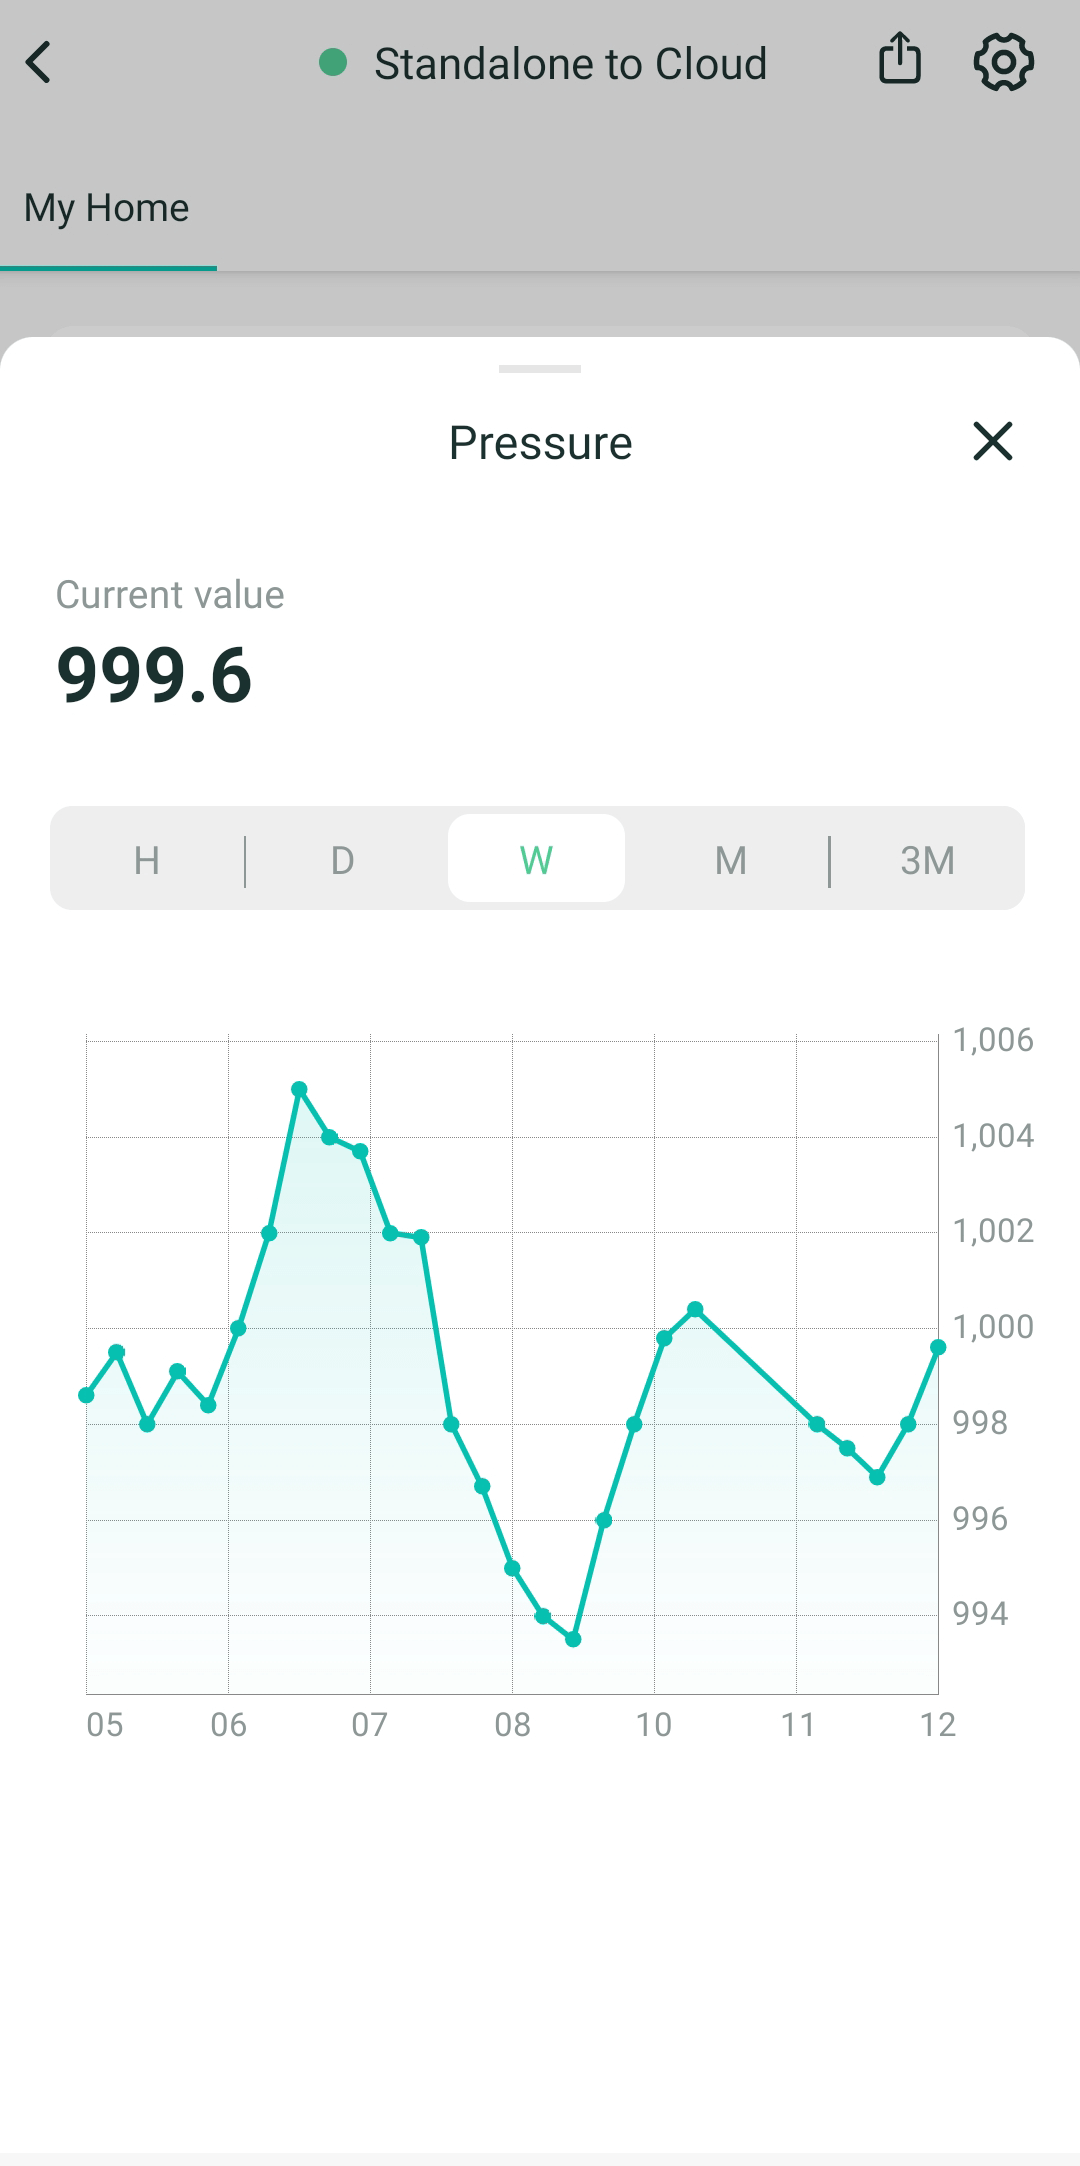
These are examples of accurate graphs from a mobile application: dynamics of air temperature, humidity, and pressure: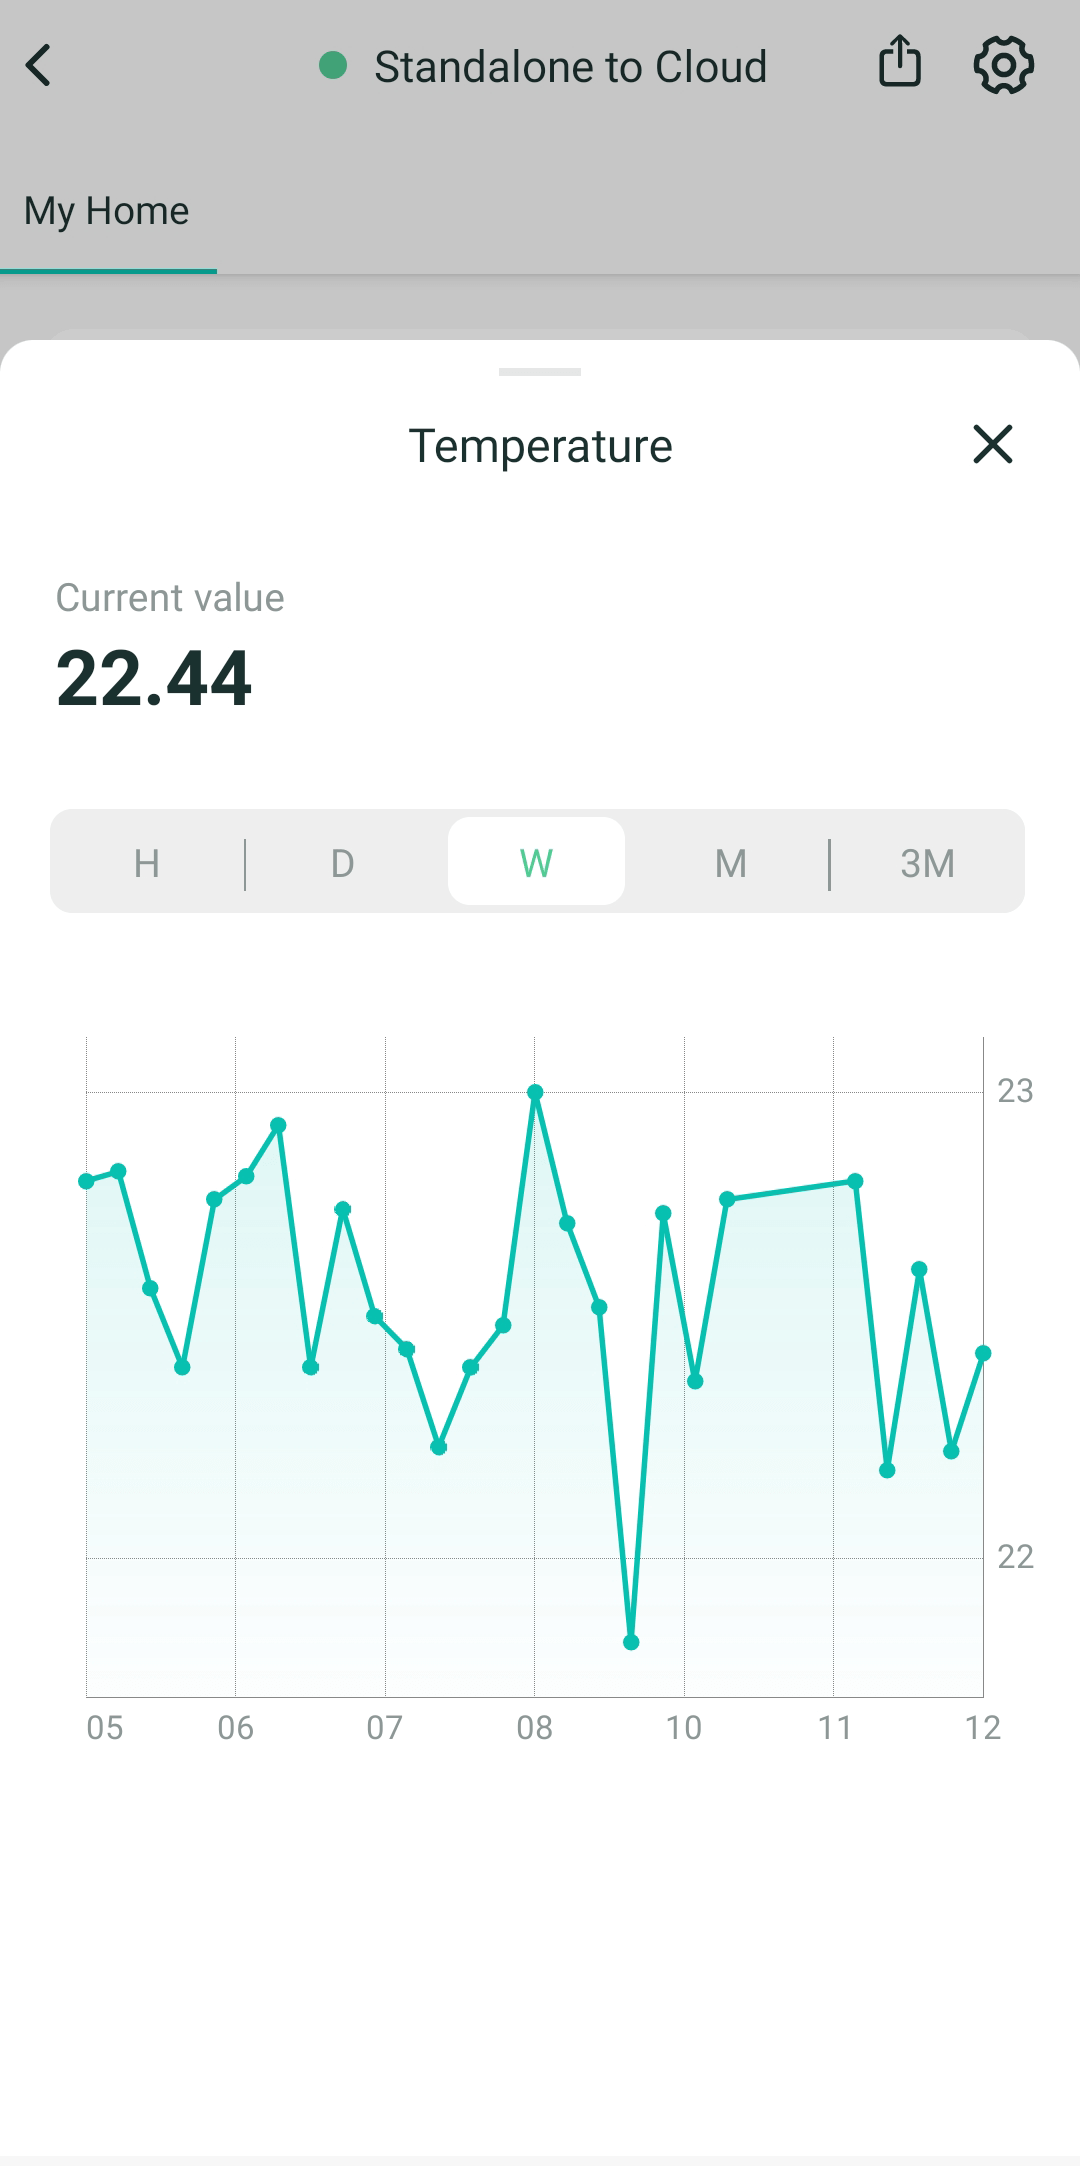
Don't forget to share this post!
Read Next
 2Smart Cloud for ESP32 microcontroller: functionality and operating instructions")


")


Let’s dive into your case
Share with us your business idea and expectations about the software or additional services.
