
Table of contents:
The firmware of IoT devices connected to the 2Smart platform and its white-label instances includes a web admin panel for device management. While the core functionality of this panel was established at the platform’s launch, we continually enhance it. This article introduces a newly implemented feature in the device’s built-in web admin panel: the ability to view and download device logs. We will demonstrate how this is integrated at the firmware level and the benefits it offers to device administrators.
Why Device Log Viewing is Essential in the Web Admin Panel
When a device behaves unexpectedly, it is not always possible to identify the issue through its parameters. We often encounter this during edge cases — scenarios that were not anticipated during implementation and were missed by the testing team due to their extreme nature in real-world conditions.
In these situations, we start gathering information from the user, attempting to replicate the problem on our side. Sometimes, this additional info is helpful, making the cause of the issue or device misbehavior clear, but not always. During these moments, the only way to obtain complete and comprehensive information is to examine the device logs.
Clearly, asking users to physically connect to the device and extract logs themselves is impractical and user-unfriendly. Such a process would be cumbersome and beyond the technical capabilities of many users. Recognizing this, we focused on developing an intuitive and accessible tool that allows users to view and download logs effortlessly.
Let’s collaborate
We’re empower your business with our technology expertise
The firmware of most 2Smart devices includes a web admin panel for device management. This is available to all third-party developers using the 2Smart SDK for firmware development and is, of course, present in all devices whose firmware was created with our team’s direct involvement. We decided that the web admin panel was the perfect place to integrate the new monitoring tool.
We created a new section in the device’s web admin panel called “Diagnostics,” where users can view logs from the device and download them for further analysis. Now, when clients encounter unclear issues, they can simply go to this page, download the logs, and send them to our team for investigation. This process is quick and highly informative.
At present, this feature is available only to 2Smart’s commercial clients. However, we plan to integrate it into the platform’s SDK in the future, making it accessible to all developers.
How It Works
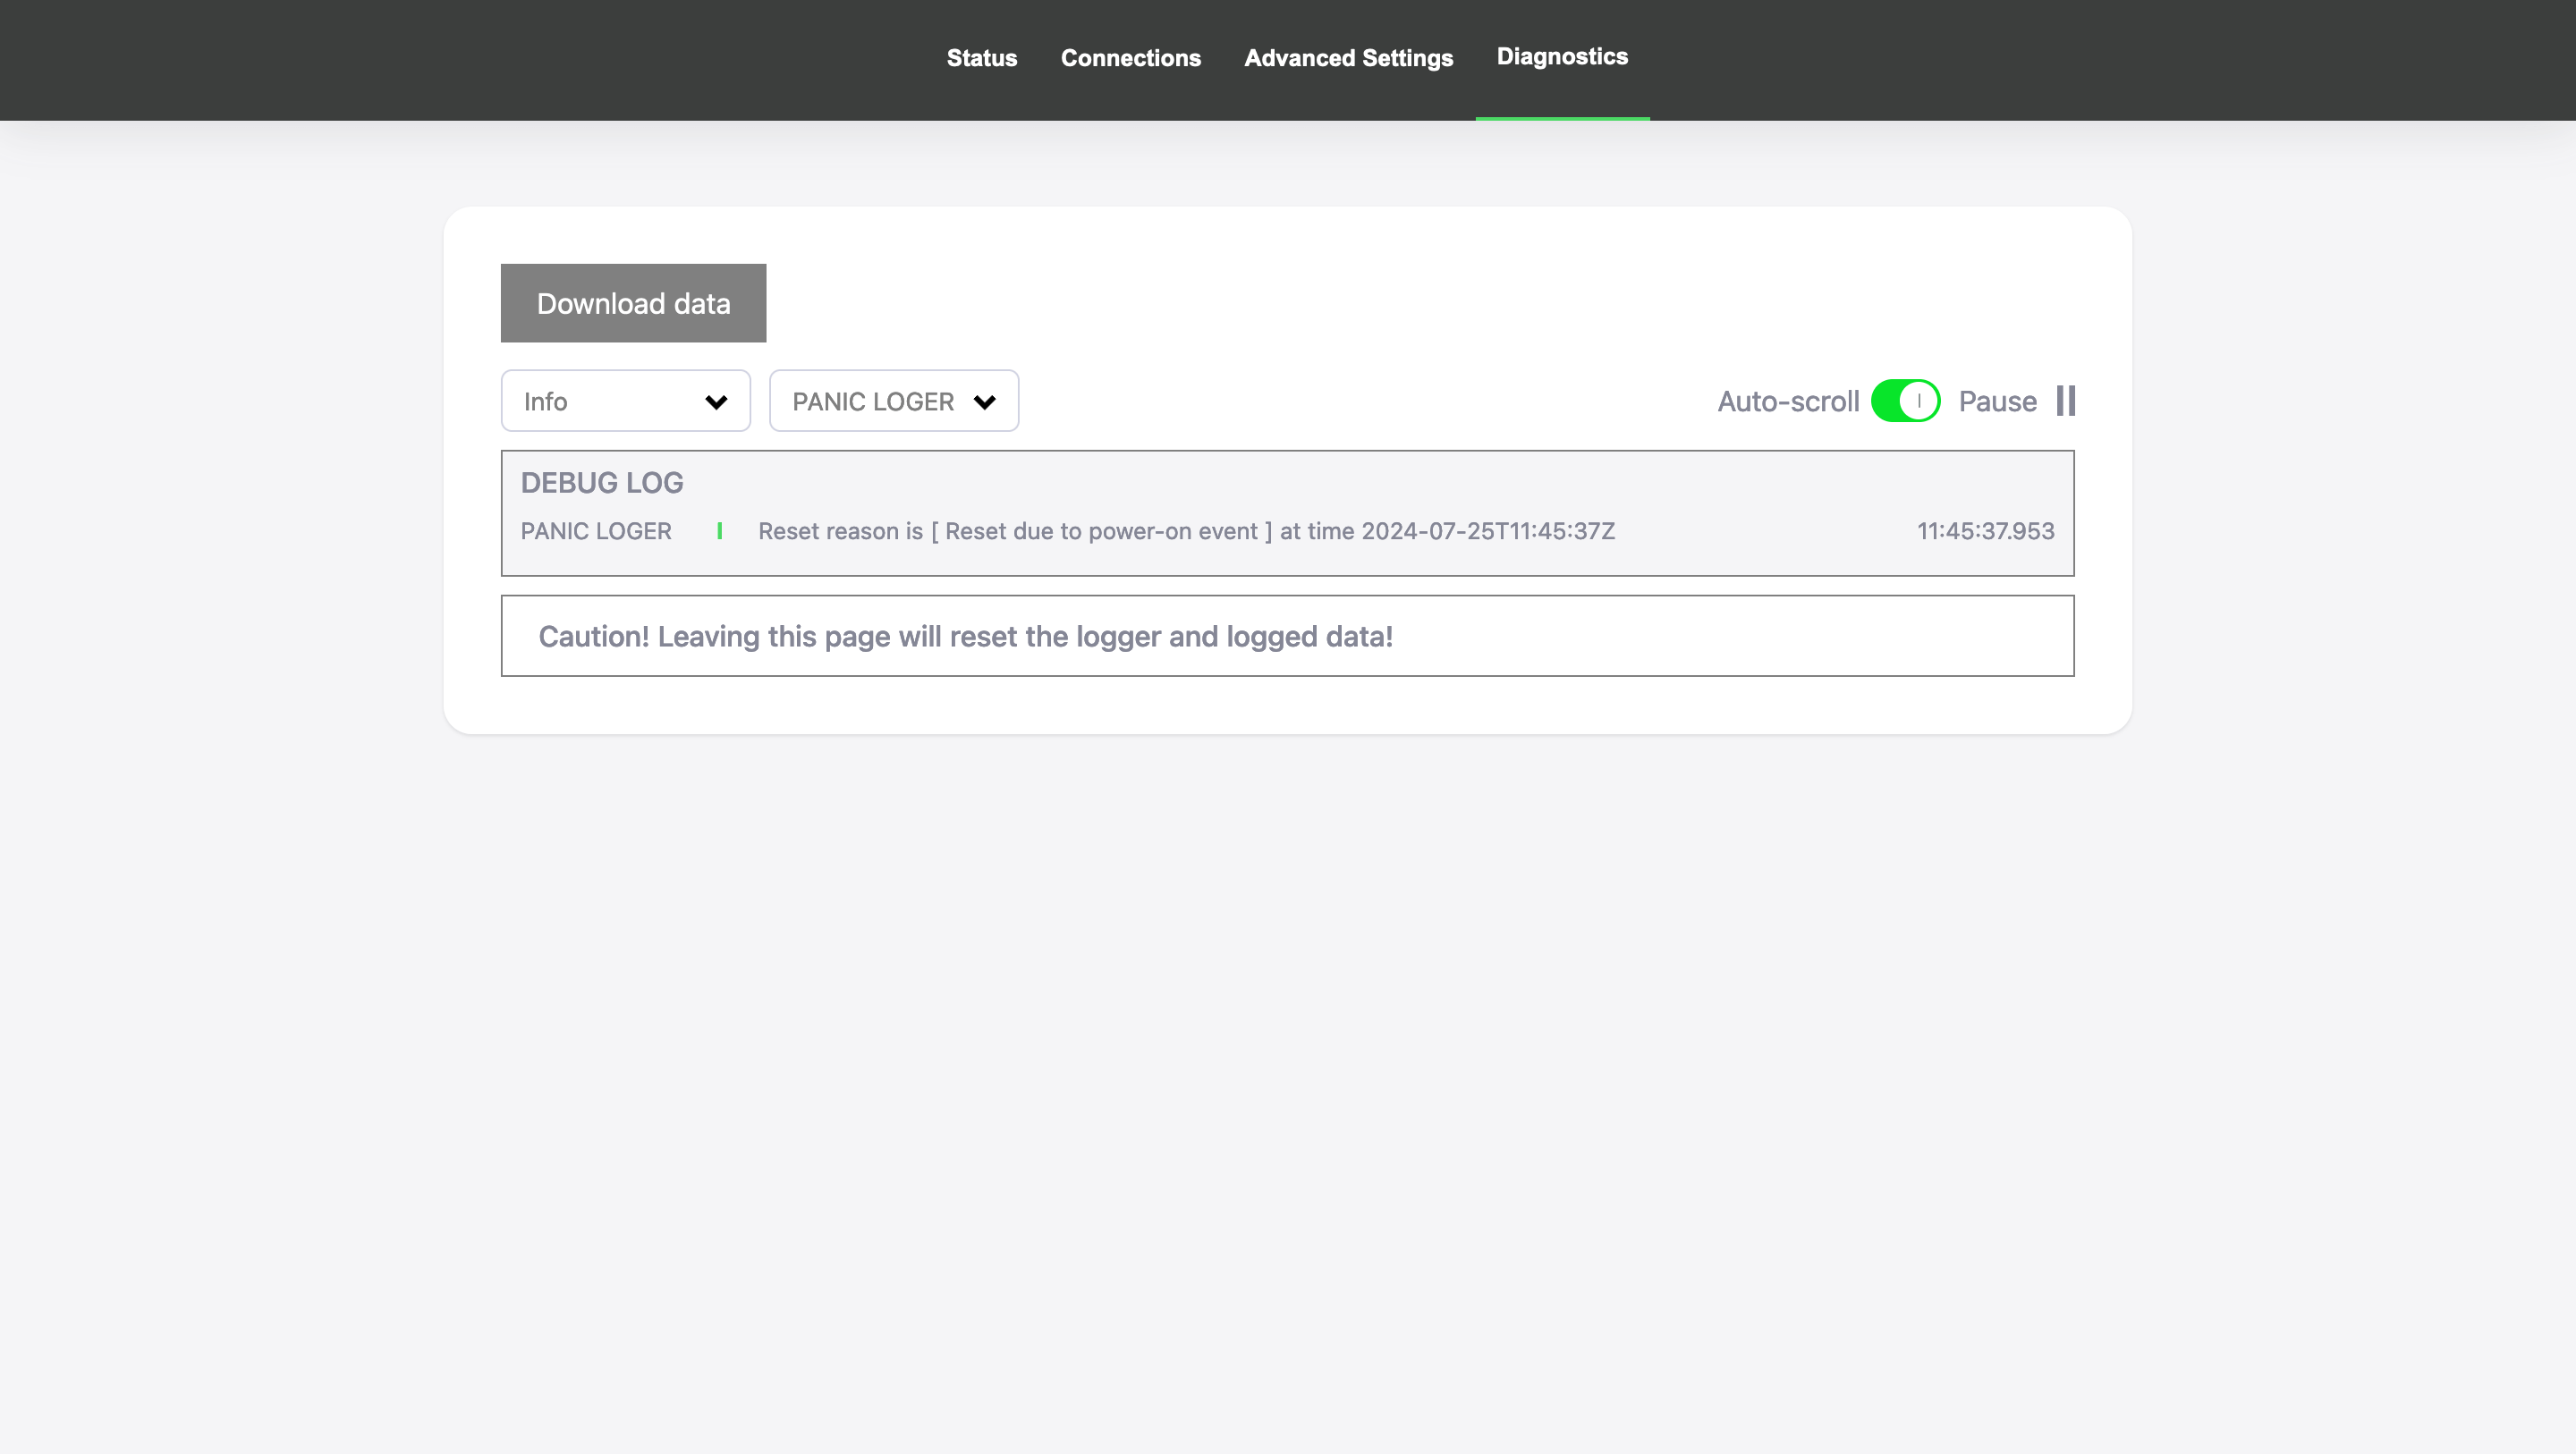
The “Diagnostics” page in the device’s web admin panel is designed to give users easy access to device logs for monitoring and troubleshooting. This page contains two filters and three control buttons, making it straightforward to navigate and manage logs.
Filters
- Log Level Filter: Allows users to filter logs by their severity level: info, warning, or error. This helps in quickly identifying critical issues.

- Tag Filter: Enables filtering logs by tag, an identifier in the code that indicates which module created the log. This is useful for pinpointing issues within specific parts of the firmware.

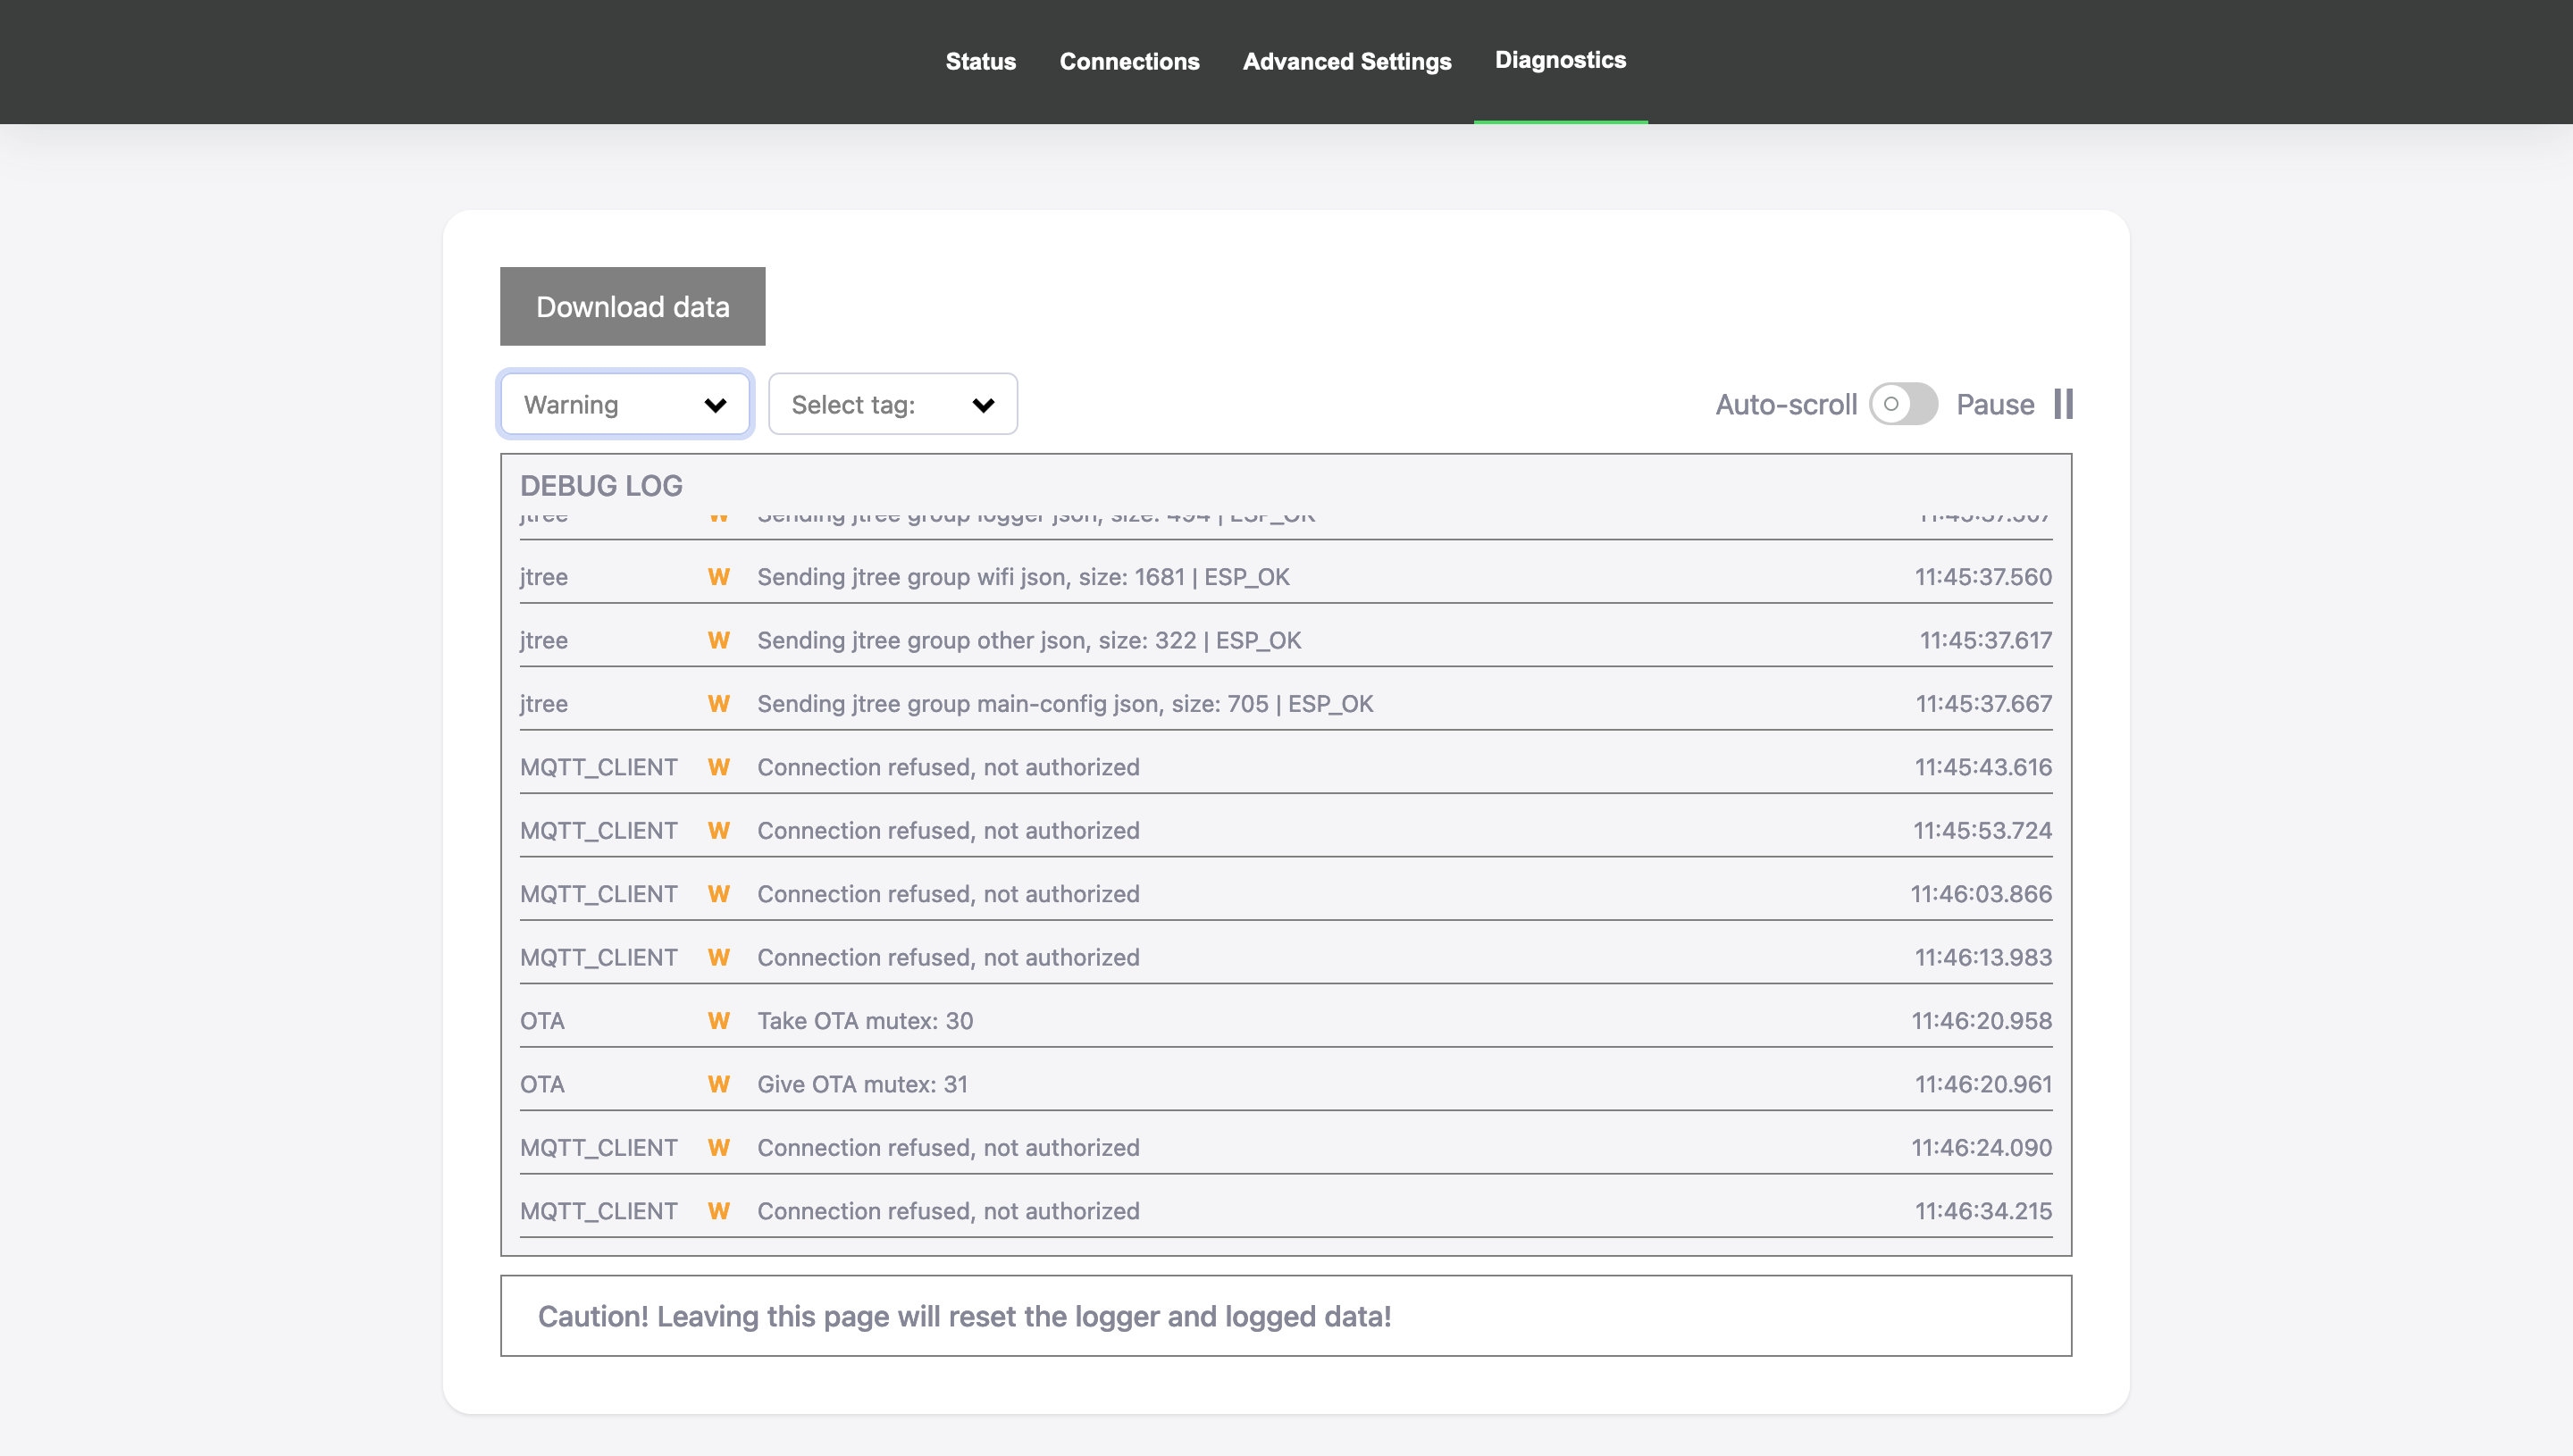
Controls:
- “Auto-scroll”: Toggles automatic scrolling to the newest log entry. When enabled, the page will automatically scroll down as new logs are added, ensuring you always see the latest information.
- “Pause”/”Start”: Allows the user to stop and resume log updates. This is helpful when they need to analyze specific logs without new entries interfering.
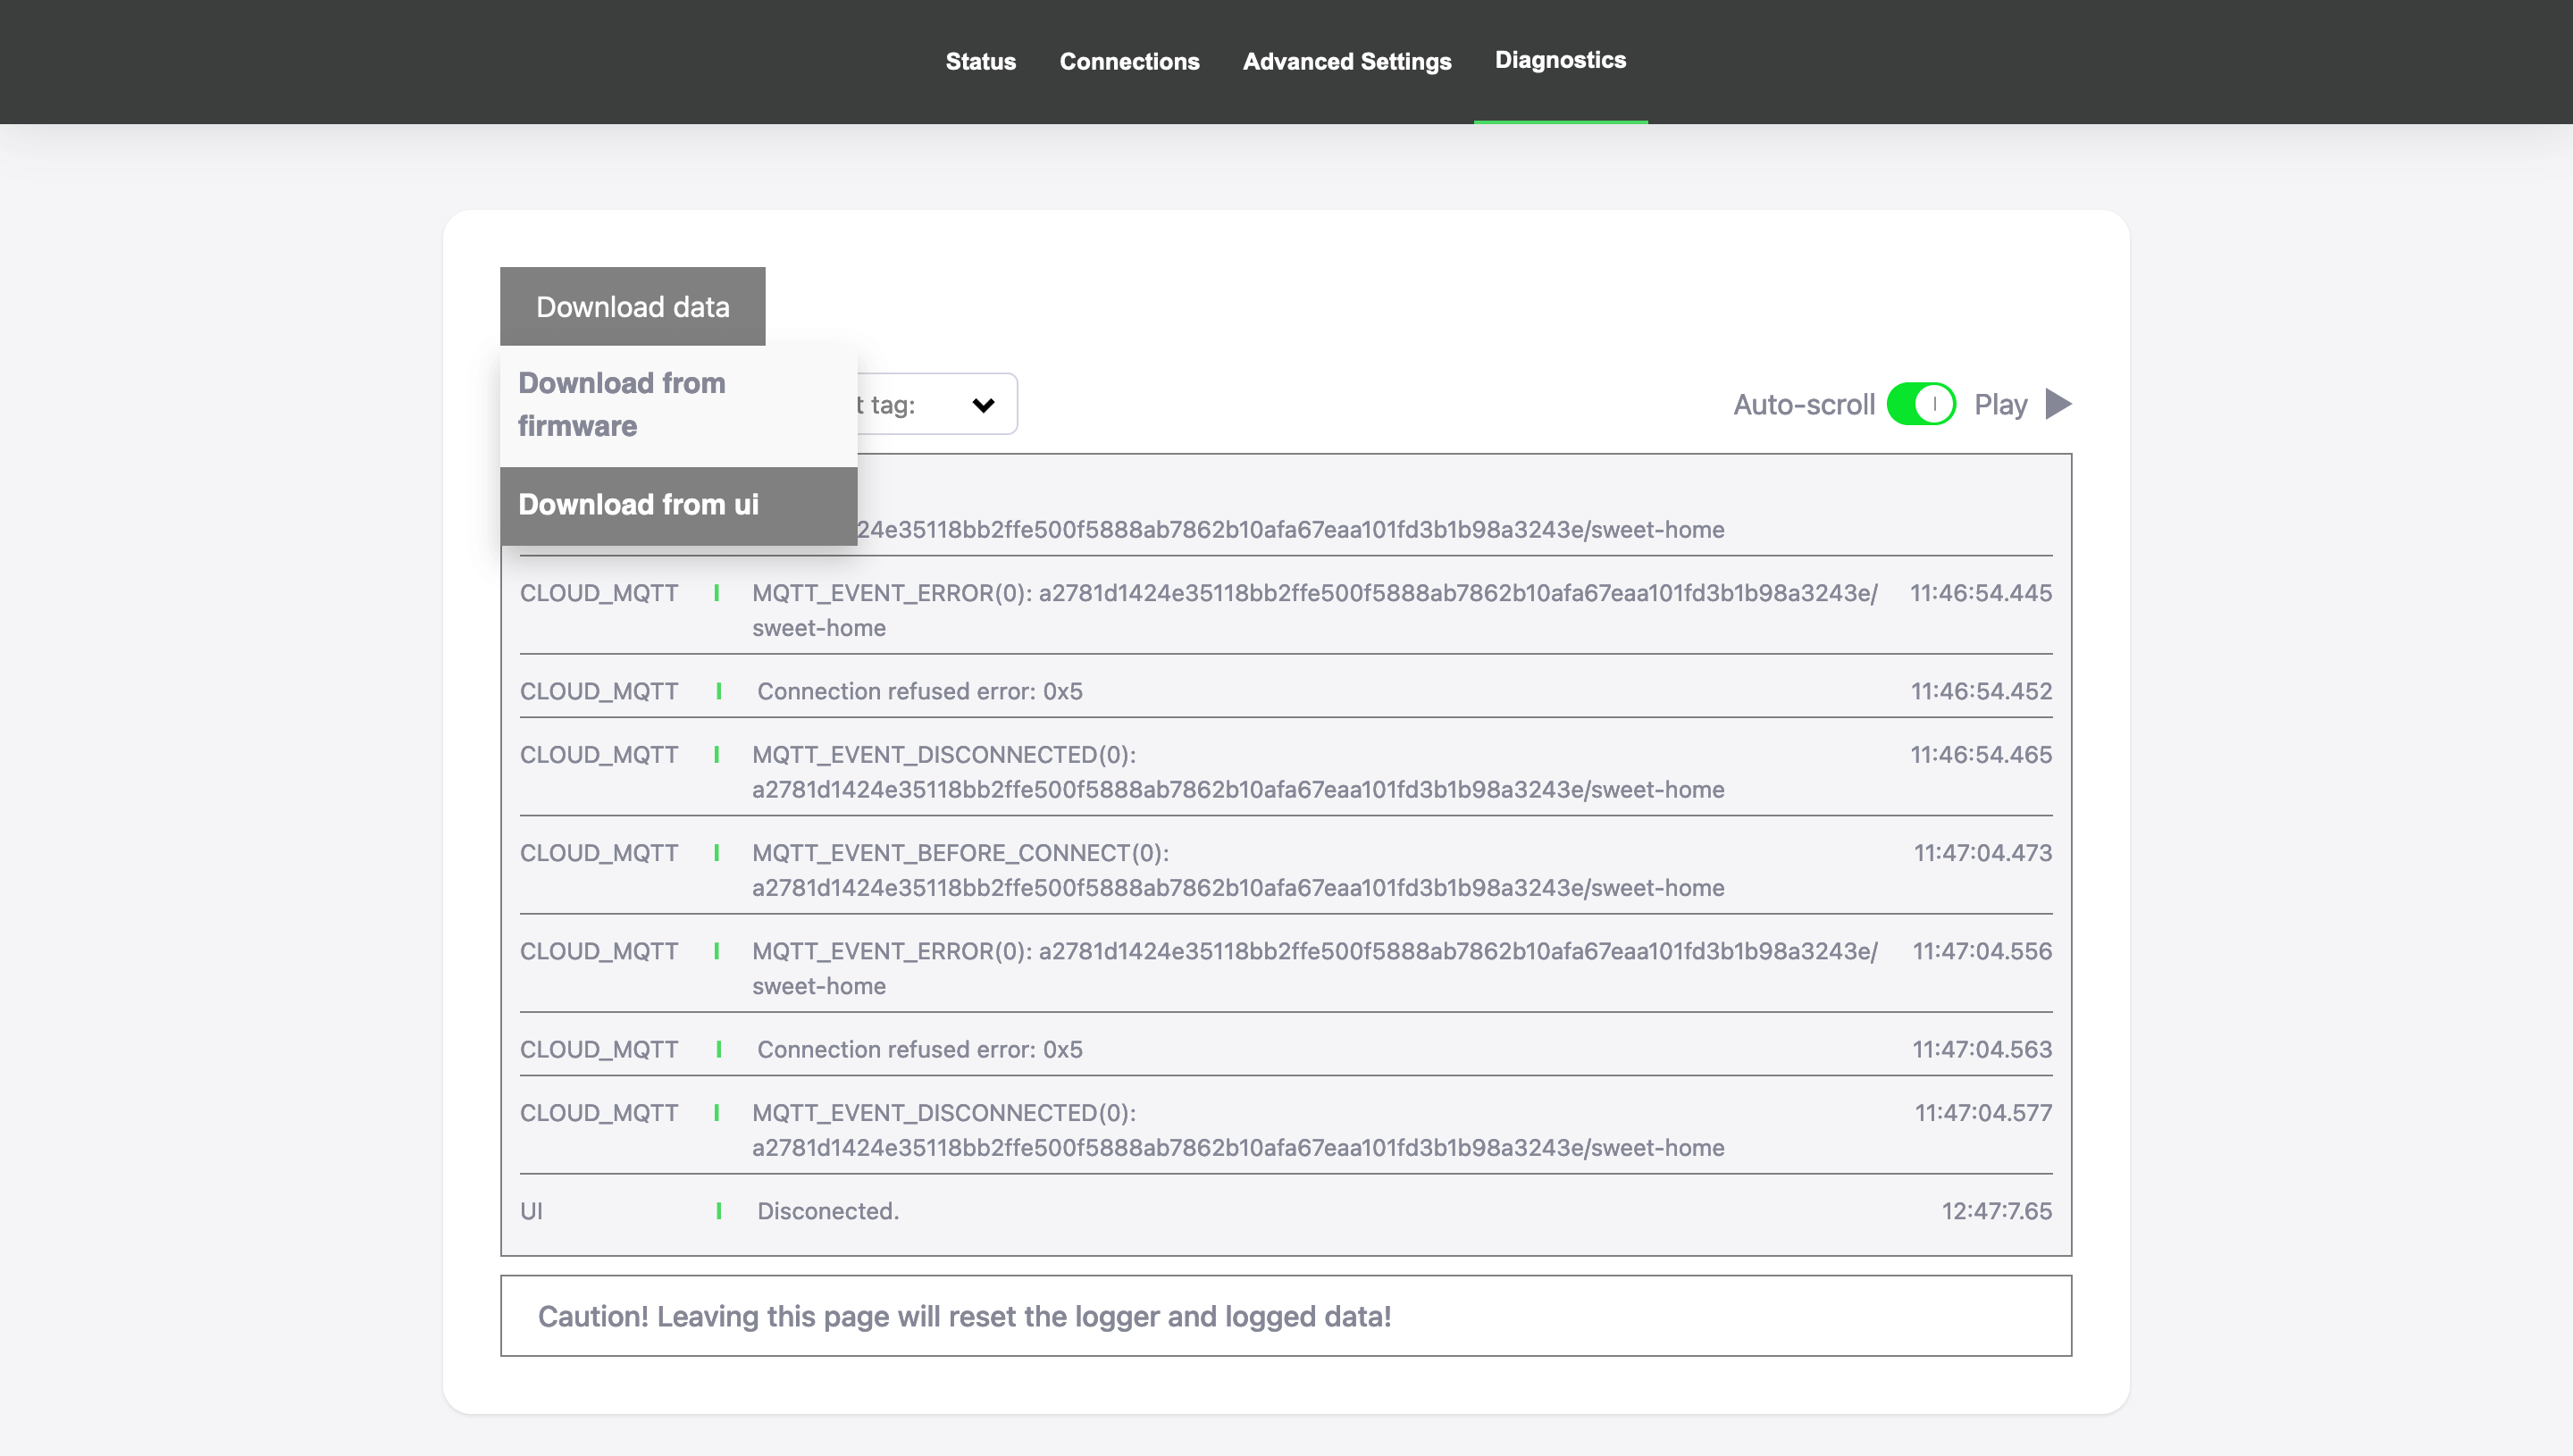
- “Download data”: Provides options to download logs for further analysis.
The “Download data” button offers two options:
- “Download from UI”: Downloads the logs currently visible on the diagnostics page. This is useful for a quick snapshot of recent activity.
- “Download from firmware”: Downloads a more comprehensive set of logs directly from the firmware’s file system. This includes additional logs that may not be displayed in the web admin panel, providing a deeper insight into device performance and issues.
Interaction with Firmware
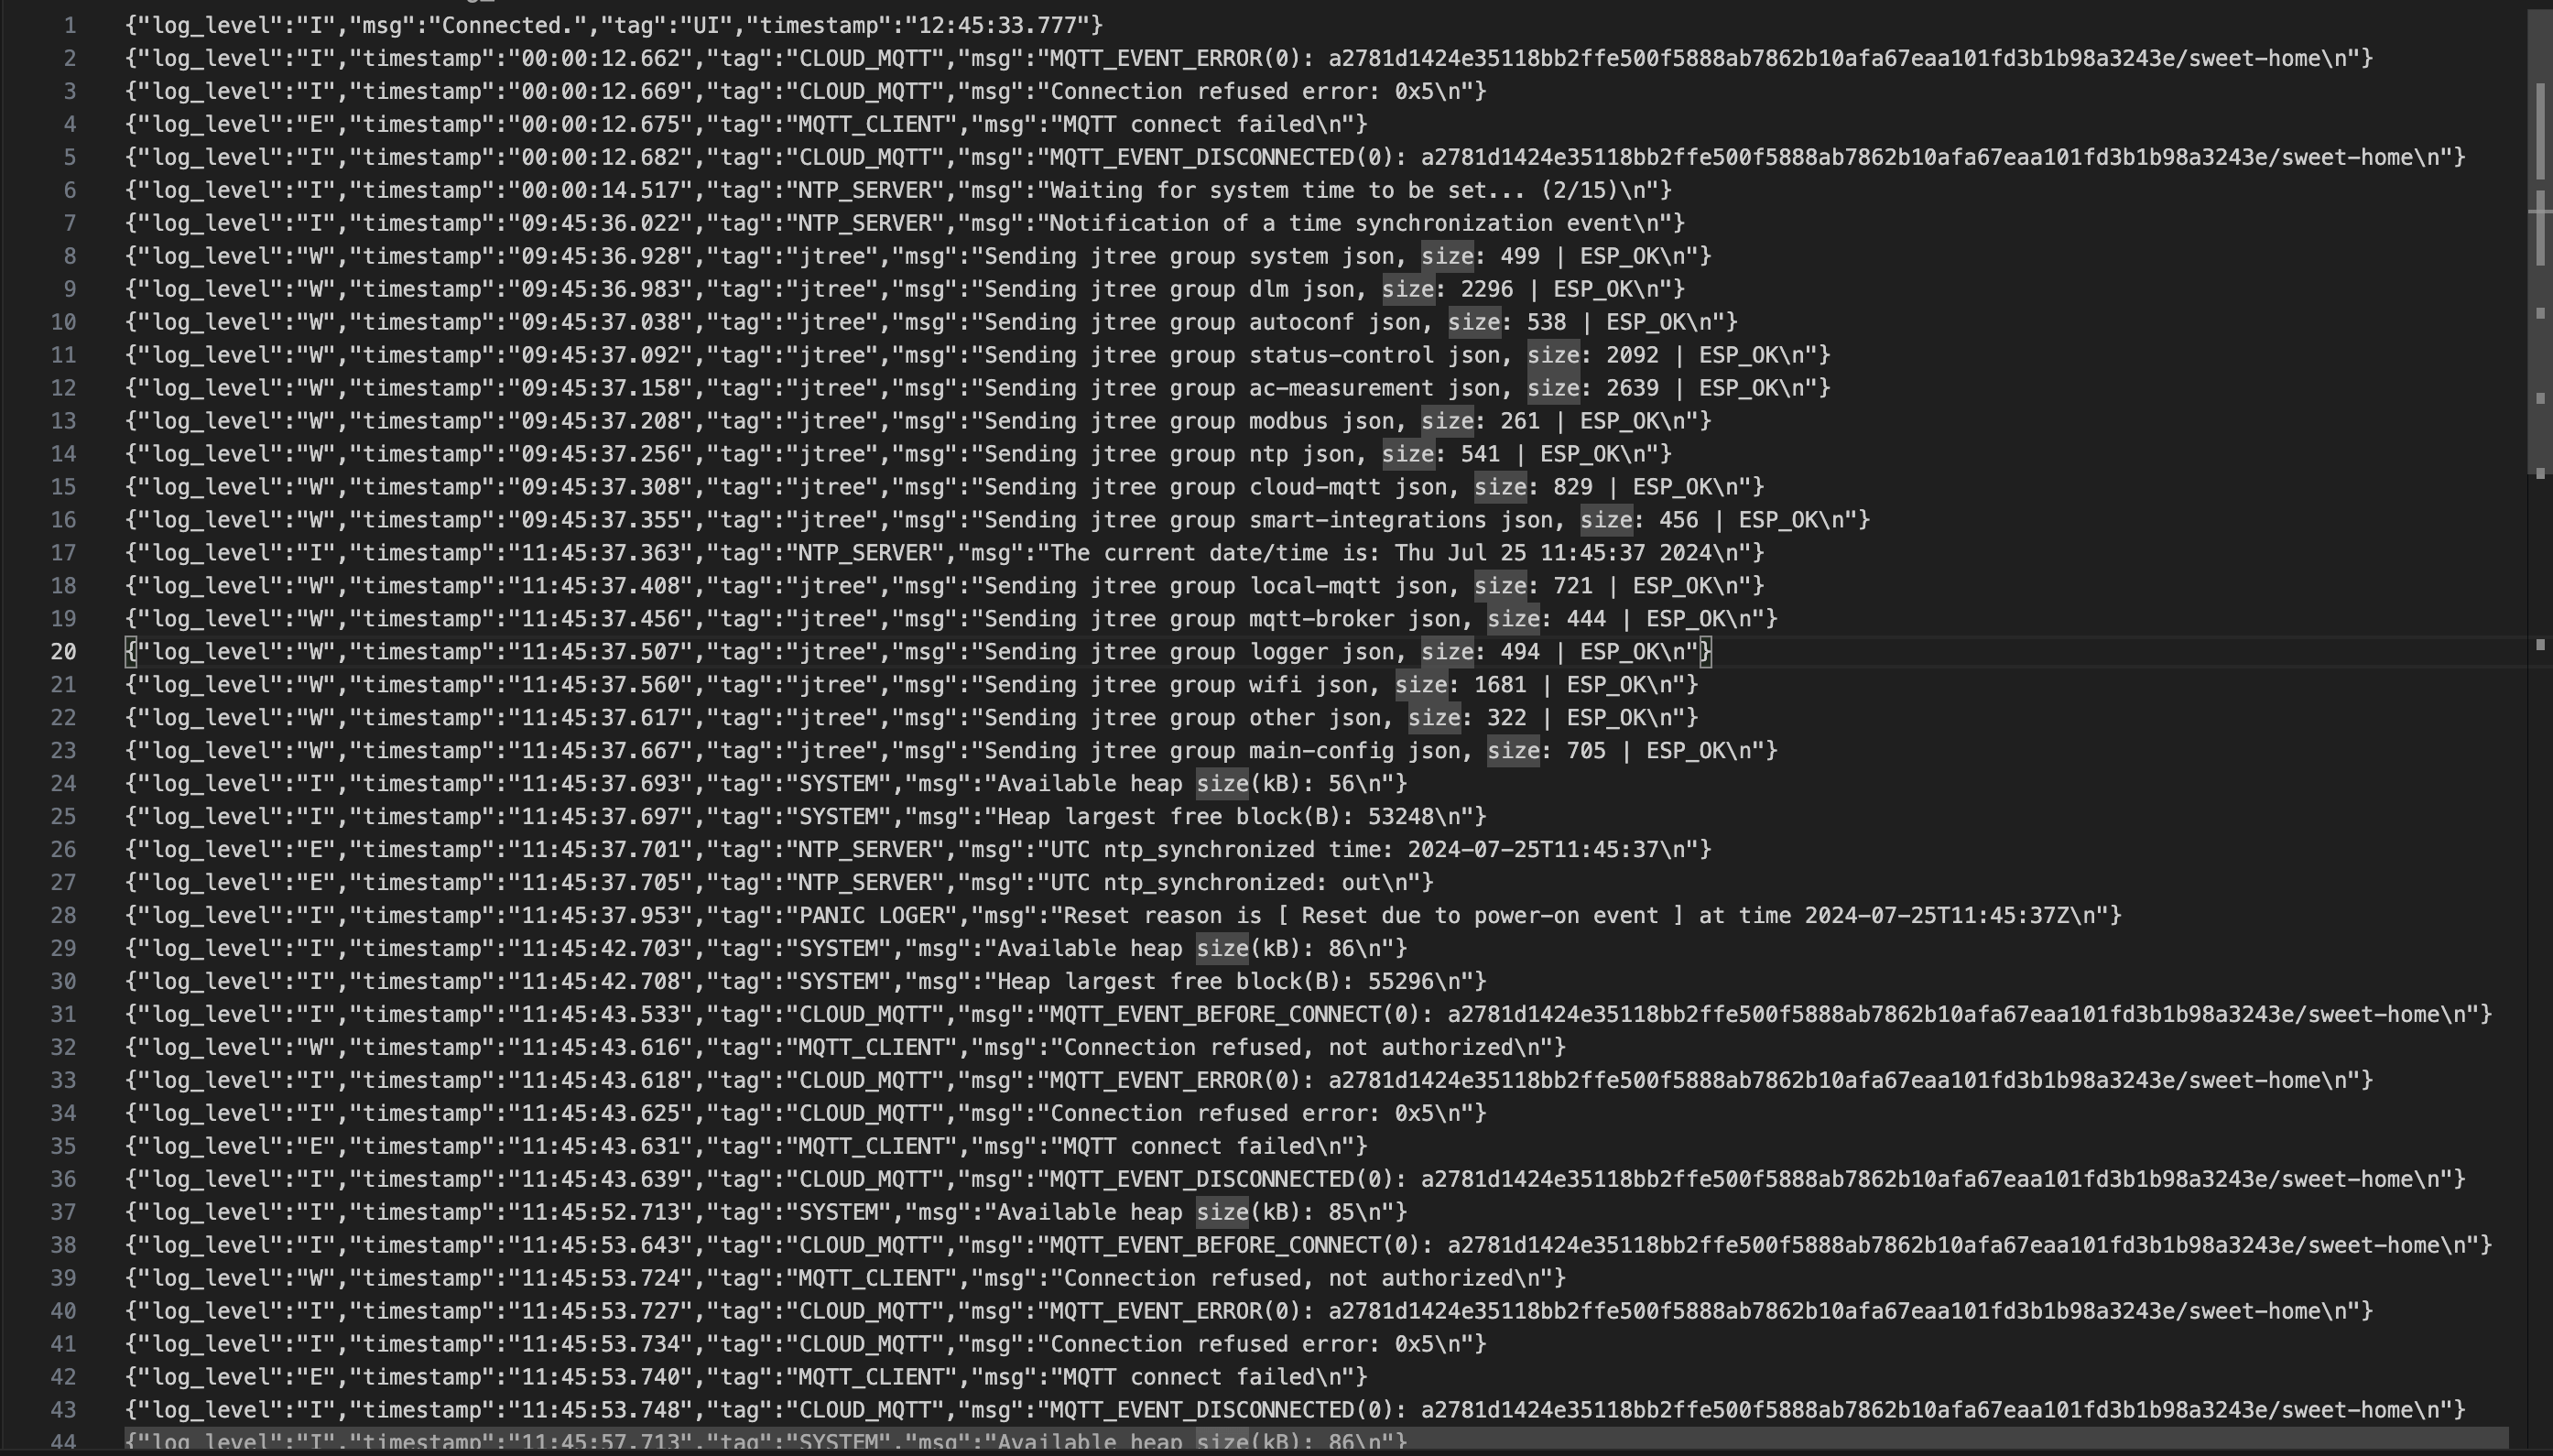
Communication between the built-in web admin panel and the device occurs through a WebSocket server, to which the device sends logs. The logs are formatted as follows:
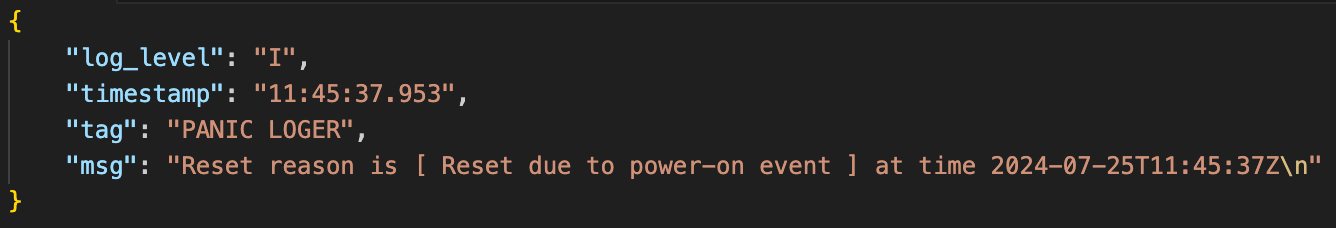
"log_level"– Values can be I, W, or E (info, warning, error)."timestamp"– The time the log was created."tag"– Log tag (as mentioned above)."msg"– The log message body.
How It’s Implemented in the Firmware
For firmware development, we use ESP-IDF v4.4. Logging is performed using the following macros:
ESP_LOGE– error (lowest).ESP_LOGW– warning.ESP_LOGI– info.ESP_LOGD– debug.ESP_LOGV– verbose (highest).
We have limited logging to three levels: info, warning, and error. To “redirect” logs from these macros to WebSocket, we override the logging function using the following command:
int vprintf_dispatcher(const char* szFormat, va_list args)
{
    …
}

esp_log_set_vprintf(vprintf_dispatcher);
Here, vprintf_dispatcher is our custom function for handling logs.
The code implementation is as follows:
typedef struct s_log_message
{
   char *timestamp, *tag, *msg, *buffer;
   char log_level[2];
} log_message;


// be sure to free(msg.buffer) when finished
log_message prepare_message(const char* szFormat, va_list args)
{
   char* format = szFormat;
   va_list arguments = args;


   // if format contains control characters, skip them
   if (format[0] == 27)
   {
       format = format+7;
   }
   char *log_print_buffer = (char*)malloc(SHORT_LOG_SIZE); // big buffer size, better move it to the heap
   if (!log_print_buffer)
   {
       log_message res = {
           .timestamp = NULL,
           .tag = NULL,
           .msg = NULL,
           .log_level = {0,0},
           .buffer = NULL
       };
       return res;
   }
   vsnprintf (log_print_buffer, SHORT_LOG_SIZE, format, args);
   char *end = strchr(log_print_buffer, 27);
   if (end != NULL)
   {
       *end ='\n';
       *(end+1) ='\0';
   }


   // check if message is not one of the not-standard messages
   if ((format[4] == 's') && (format[3] == '%'))
   {
       log_message res = {
           .timestamp = va_arg(arguments, char*),
           .tag = va_arg(arguments, char*),
           .msg = separate_msg(log_print_buffer),
           .log_level = {format[0],'\0'},
           .buffer = log_print_buffer
       };
       return res;
   }


   // fallback for non-standard messages
   log_message res = {
       .timestamp = va_arg(arguments, char*),
       .tag = va_arg(arguments, char*),
       .msg = NULL,
       .log_level = "0",
       .buffer = log_print_buffer
   };
   return res;
}


int vprintf_dispatcher(const char* szFormat, va_list args)
{
   int ret = 0;
   log_message msg = prepare_message(szFormat, args);
   if(!msg.buffer)
   {
       ESP_LOGE(TAG, "log_message.buffer allocation failed");
       return ret;
   }


   ret = vprintf(szFormat, args); // log to serial
   write_to_websocket(&msg); // log to WEB
   write_to_file(&msg); // log to FS


   free(msg.buffer);
   return ret;
}
The vprintf_dispatcher function captures the log when an ESP_LOG* macro is called and passes it to the prepare_message function, which converts the log into a log_message structure. After conversion, vprintf_dispatcher sends the logs to a function for WebSocket transmission and for writing to a file.
Regarding the functions write_to_websocket and write_to_file, their implementation will be detailed in a separate article later. Therefore, their descriptions are omitted here.
Future Integration Plans
At present, the feature described above is available only to 2Smart’s commercial clients. However, we plan to integrate it into the platform’s SDK in the future, making it accessible to all developers. This will further extend the benefits of our logging tool to a broader audience, enhancing the overall functionality and user experience of the 2Smart platform.
So please note that the “Diagnostics” section is unavailable if you used the 2Smart SDK for firmware development, as this feature has not yet been integrated into the SDK. Stay tuned for updates as we work on expanding this functionality to all users.
Let’s collaborate
We’re empower your business with our technology expertise
Conclusion
The addition of the log viewing and downloading feature in the 2Smart device’s built-in web admin panel significantly enhances our connected device management capabilities and makes troubleshooting more efficient and effective. This new functionality allows us to quickly identify and resolve issues, especially those arising from unexpected edge cases.
Our implementation ensures that logs are easily accessible through a user-friendly browser interface without requiring physical access to the device. The process is streamlined and informative, saving valuable time and effort. As we continue to refine and expand our platform, these enhancements underscore our commitment to providing robust and user-centric IoT solutions.
Stay tuned for our upcoming article, where we will dive deeper into the specifics of how logs are transmitted and stored using the write_to_websocket and write_to_file functions. This will provide a comprehensive understanding of the complete logging process and how it benefits our users.
Frequently Asked Questions
What is the purpose of the new log viewing feature in the web admin panel?
The log viewing feature allows administrators to monitor device activity, troubleshoot issues, and download logs for further analysis. This helps identify and resolve unexpected behaviors more efficiently.
How do I access the log viewing feature in the web admin panel?
Navigate to the “Diagnostics” section in the device’s built-in web admin panel. Here, you can filter logs by log level and tag, as well as control log display options and download logs.
Please note that the “Diagnostics” section may be unavailable if you used the 2Smart SDK for firmware development, as this feature has not yet been integrated into the SDK.
What are the benefits of downloading firmware logs versus UI logs?
UI logs are those visible on the diagnostics page, providing immediate insights into recent activities. Firmware logs, however, are more comprehensive, including additional data written to the file system. This offers deeper insights into device performance and issues.
How does the log filtering system work?
Logs can be filtered by log level (info, warning, error) and by tag, which identifies the module that generated the log. This helps in quickly locating relevant logs for specific issues.
What should I do if the device logs indicate an issue I cannot resolve?
If you encounter an issue that you cannot resolve, download the logs and send them to our support team. This will provide us with the necessary information to investigate and assist you in resolving the problem.
Don't forget to share this post!
Read Next
")


Let’s dive into your case
Share with us your business idea and expectations about the software or additional services.
